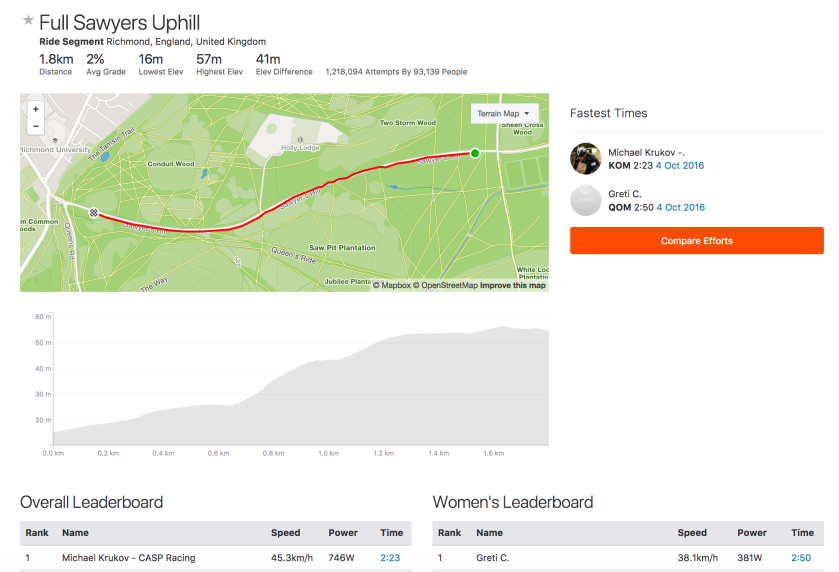
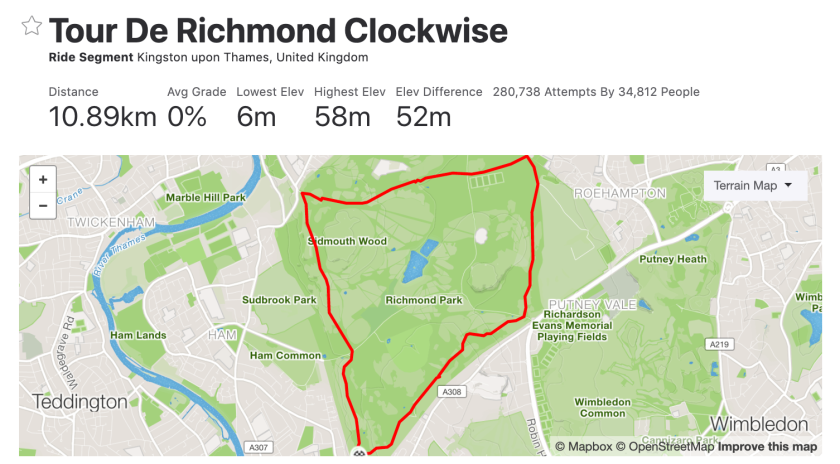
Strava – Tour de Richmond Park Clockwise

Screenshot 2019-05-22 at 15.24.51

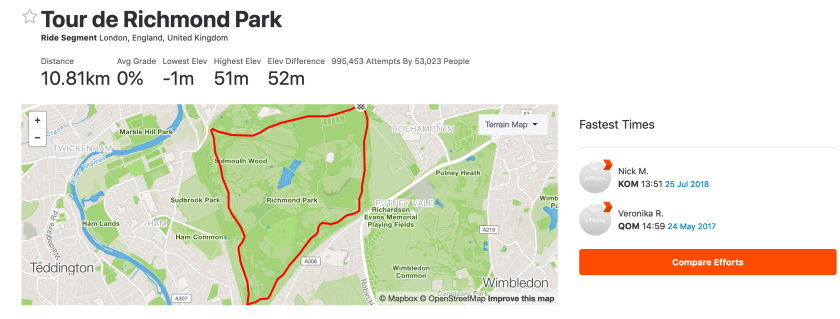
Following my recent update on the Tour de Richmond Park leaderboard, a friend asked about the ideal weather conditions for a reverse lap, clockwise around the park. This is a less popular direction, because it involves turning right at each mini-roundabout, including Cancellara corner, where the great Swiss rouleur crashed in the 2012 London Olympics, costing him a chance of a medal.

An earlier analysis suggested that apart from choosing a warm day and avoiding traffic, the optimal wind direction for a conventional anticlockwise lap was a moderate easterly, offering a tailwind up Sawyers Hill. It does not immediately follow that a westerly wind would be best for a clockwise lap, because trees, buildings and the profile of the course affect the extent to which the wind helps or hinders a rider.

Currently there are over 280,000 clockwise laps recorded by nearly 35,000 riders, compared with more than a million anticlockwise laps by almost 55,000 riders. As before, I downloaded the top 1,000 entries from the leaderboard and then looked up the wind conditions when each time was set on a clockwise lap.

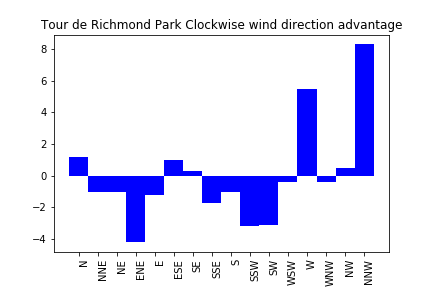
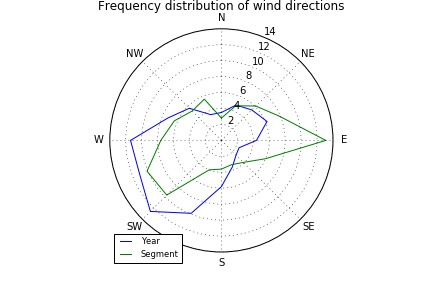
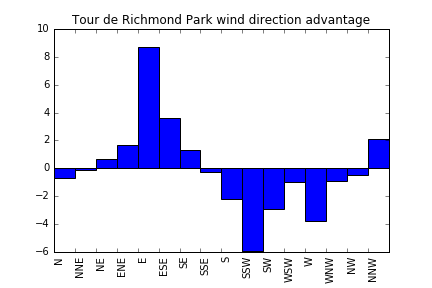
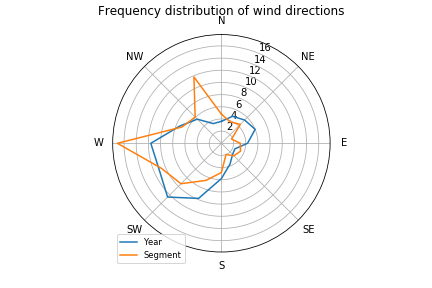
In the previous analysis, I took account of the prevailing wind direction in London. If wind had no impact, we would expect the distribution of wind directions for leaderboard entries to match the average distribution of winds over the year. I defined the wind direction advantage to be the difference between these two distributions and checked if it was statistically significant. These are the results for the clockwise lap.

RoseSegmentBarSegmentclockwise

The wind direction advantage was significant (at p=1.3%). Two directions stand out. A westerly provides a tailwind on the more exposed section of the park between Richmond Gate and Roehampton, which seems to be a help, even though it is largely downhill. A wind blowing from the NNW would be beneficial between Roehampton and Robin Hood Gate, but apparently does not provide much hindrance on the drag from Kingston Gate up to Richmond, perhaps because this section of the park is more sheltered. The prevailing southwesterly wind was generally unfavourable to riders setting PBs on a clockwise lap.

The excellent mywindsock web site provides very good analysis for avid wind dopers. This confirms that the wind was blowing predominantly from the west for the top ten riders on the leaderboard, including the KOM, though the wind strength was generally light.

The interesting thing about this exercise is that it demonstrates a convergence between our online and our offline lives, as increasing volumes of data are uploaded from mobile sensors. A detailed analysis of each section of the million laps riders have recorded for Richmond Park could reveal many subtleties about how the wind flows across the terrain, depending on strength and direction. This could be extended across the country or globally, potentially identifying local areas where funnelling effects might make a wind turbine economically viable.

References

Jupyter notebook for calculations

Strava: Richmond Park leaderboard update

Screenshot 2019-04-27 at 16.15.55

An extended version of this blog was published by cyclist.co.uk

If you have ever had the feeling that it is becoming harder to rise up the Strava leaderboards and that KOMs are ever more elusive, you are right. I took a snapshot of the top 1000 entries for the Tour de Richmond Park segment in April 2019 and compared it with the leaderboard from February 2017 that I used for an earlier series of blogs.

The current rankings are led by a team of Onyx RT riders, who rode as a group at 6:02am on 25 July 2018, beating Rob Sharland’s solo effort by 6 seconds, with a time of 13:51. Some consider that targeting a KOM by riding as a team time trial is a kind of cheating. Having said that, many riders have achieved their best laps around Richmond Park while riding in the popular Saturday morning and Wednesday evening chain gang rides. In fact, if the Onyx guys had checked my blogs on the optimal wind direction and weather conditions, and chosen a warm evening with a moderate Easterly wind, they would have probably gone faster.

Survival of the fittest

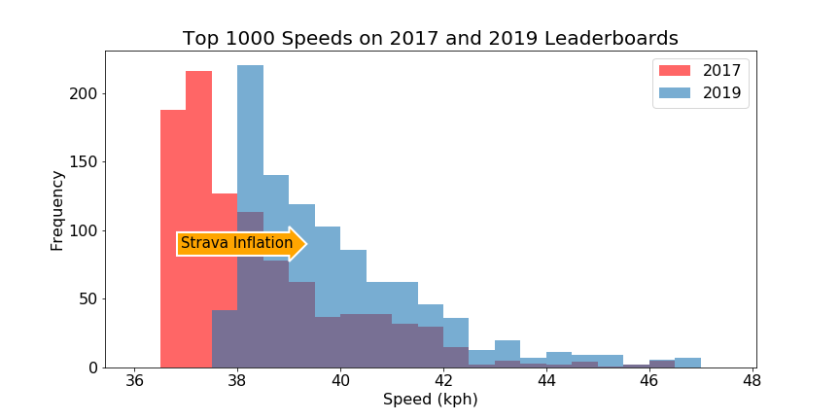
The Darwinian nature of Strava leaderboards ensures that the slowest times are continually culled. Over the two year gap, the average time of the top 1000 riders improved by 35 seconds, which equates to an increase in speed of about 1.6% per annum. In 2017, a time of 17:40 was good enough to reach the top 1000. You now need to complete the rolling 10.8km course in less than 17:07, averaging over 37.8kph, to achieve the same ranking. The rider currently ranked 1000th would have been 503rd on the 2017 leaderboard, making the turnover about 50%.

Speed20172019

Strava inflation produces a right shift in the speeds at which riders complete the segment. Rider speeds exhibit “long tailed” distributions, with just a few riders producing phenomenal performances: although many people can hold an average of 38kph, it remains very hard to complete this segment at over 42kph.

More faster riders

A total of 409 names dropped off the bottom of the 2017 leaderboard, to be replaced by new faster riders. Some of these quicker times were set by cyclists who had improved enough to rise up the leaderboard into the top 1000, while others were new riders who had joined Strava or not previously done a lap of Richmond Park.

Riders riding faster

Of the 591 riders who appeared on both leaderboards, 229 improved their times by an average of 53 seconds. These included about 90 riders who would have dropped out of the top 1000, had they not registered faster times.

Getting faster without doing anything

One curious anomaly arose from the analysis: 32 efforts appearing on the 2019 leaderboard were recorded on dates that should have shown up on the 2017 leaderboard. Nine of these appeared to be old rides uploaded to Strava at a later date, but that left 23 efforts showing faster times in 2019 than 2017 for exactly the same segments completed by the same cyclists on the same rides.

For example, Gavin Ryan’s ride on 25 August 2016 appeared 8th on the 2017 leaderboard with a time of 14:23, but now he appears as 16th on the 2019 leaderboard with a time of 14:20! It seems that Strava has performed some kind of recalculation of historic times, resulting a new “effort_id” being assigned to the same completed segment. If you want to see a list of other riders whose times were recalculated, click here and scroll down to the section entitled “Curious anomaly”.

Summer is the time to go faster

Strava leaderboards were never designed to rank pure solo TT efforts. Although it is possible to filter by sex, age, weight and date, it remains hard to distinguish between team versus solo efforts, road versus TT bikes and weather conditions. The nature of records is that they are there to be broken, so the top times will always get faster. The evidence from this analysis suggests that there are more faster cyclists around today than two years ago.

As the weather warms up, perhaps you can pick a quiet time to move up the leaderboard on your favourite segment, while showing courtesy to other road users and respecting the legal speed limit.


Suddenly Summer in Richmond Park

Tour de Richmond Park Leaderboard – year to date 2018

Screen Shot 2018-04-20 at 14.54.42

This week’s dramatic change in the weather has seen a string of quick laps recorded for the Tour de Richmond Park. Twelve out of the fastest fifteen efforts were completed on 18/19 April. Apart from the sheer pleasure of finally being able to ride in short sleeves, two meteorological factors came into play: higher temperatures and a favourable wind direction.

As noted in an earlier blog, changes in temperature have a far greater impact on air density than variations in atmospheric pressure and humidity. When I completed a lap last week, the temperature was 6oC, but on 19 April it was closer to 26oC. The warmer weather had the effect of reducing air density by more than 7%. Theoretically, this should allow you to ride about 2% faster for the same effort. Using a physics model I built last year to analyse Strava segments, it is possible to estimate the effect of variations in the factors that determine your position on the leaderboard. Based on an average power of 300W and some reasonable estimates of other variables, this rise in temperature would reduce your time from 16:25 to 16:04 (as expected, 2% quicker).

The other key factor is the wind. On 18/19 April, it was blowing from the south or southeast. This was not the mythical easterly that provides a tailwind up Sawyers Hill, but according to the analysis in another earlier blog, it is generally beneficial for doing a quick lap around the park.

I clocked up a decent time this morning, to reach 15th place on the year-to-date leaderboard, but I failed to take my own advice on the best time of day. The traffic tends to be lighter first thing in the morning or in the evening, when the park closes. After waiting until mid-morning for the temperature to rise, I ended up being blocked by slow-moving vehicles on two occasions.

Although it was frustrating having to brake for traffic, the really puzzling thing was an average power reading of 254W. This is much lower than the other riders on the leaderboard. Last week, I did a lap in 16:44 at an average power of 313W, which seems much more reasonable. Admittedly, I was wearing a skin suit today, but that would not have saved 50W. It is possible that I had some drafting benefit from the numerous cars in the park and some favourable gusts of wind. However, my suspicion is that my Garmin Vector pedals had not calibrated correctly, after I switched them from my road bike, before today’s ride.

The concluding message is get on your bike and enjoy the sunshine. And why not try to beat your best time for the Tour de Richmond Park?


Kings and Queens of the Mountains

Screen Shot 2017-11-09 at 18.40.09.png

I guess that most male cyclists don’t pay much attention to the women’s leaderboards on Strava. And if they do it might just be to make some puerile remark about boys being better than girls. From a scientific perspective the comparison of male and female times leads to some interesting analysis.

Assuming both men and women have read my previous blogs on choosing the best time, weather conditions and wind directions for the segment that suits their particular strengths, we come back to basic physics.

KOM or QOM time = Work done / Power = (Work against gravity + Drag x Distance + Rolling resistance x Distance) / (Mass x Watt/kg)

Of the three components of work done, rolling resistance tends to be relatively insignificant. On a very steep hill, most of the work is done against gravity, whereas on a flat course, aerodynamic drag dominates.

The two key factors that vary between men and women are mass and power to weight ratio (watts per kilo).  A survey published by the ONS in 2010, rather shockingly reported that the average British man weighed 83.6kg, with women coming in at 70.2kg. This gives a male/female ratio of 1.19. KOM/QOM cyclists would tend to be lighter than this, but if we take 72kg and 60kg, the ratio is still 1.20.

Males generate more watts per kilogram due to having a higher proportion of lean muscle mass. Although power depends on many factors, including lungs, heart and efficiency of circulation, we can estimate the relative power to weight ratio by comparing the typical body composition of males and females. Feeding the ONS statistics into the Boer formula gives a lean body mass of 74% for men and 65% for women, resulting in a ratio of 1.13. This can be compared against the the useful table on Training Peaks showing maximal power output in Watts/kg, for men and women, over different time periods and a range of athletic abilities. The table is based on the rows showing world record performances and average untrained efforts.  For world champion five minute efforts and functional threshold powers, the ratios are consistent with the lean mass ratio. It makes sense that the ratio should be higher for shorter efforts, where the male champions are likely to be highly muscular. Apparently the relative performance is precisely 1.21 for all durations in untrained people.

Screen Shot 2017-11-08 at 10.23.33

On a steep climb, where the work done against gravity dominates, the benefit of additional male muscle mass is cancelled by the fact that this mass must be lifted, so the difference in time between the KOM and the QOM is primarily due to relative power to weight ratio. However, being smaller, women suffer from the disadvantage that the inert mass of bike represents a larger proportion of the total mass that must be raised against gravity. This effect increases with gradient. Accounting for a time difference of up to 16% on the steepest of hills.

In contrast, on a flat segment, it comes down to raw power output, so men benefit from advantages in both mass and power to weight ratio. But power relates to the cube of the velocity, so the elapsed time scales inversely with the cube root of power. Furthermore, with smaller frames, women present a lower frontal area, providing a small additional advantage. So men can be expected to have a smaller time advantage of around 9%. In theory the advantage should continue to narrow as the gradient shifts downhill.

Theory versus practice

Strava publishes the KOM and QOM leaderboards for all segments, so it was relatively straightforward to check the basic model against a random selection of 1,000 segments across the UK. All  leaderboards included at least 1,666 riders, with an overall average of 637 women and 5,030 men. One of the problems with the leaderboards is that they can be contaminated by spurious data, including unrealistic speeds or times set by groups riding together. To combat this, the average was taken of the top five times set on different dates, rather than simply to top KOM or QOM time.

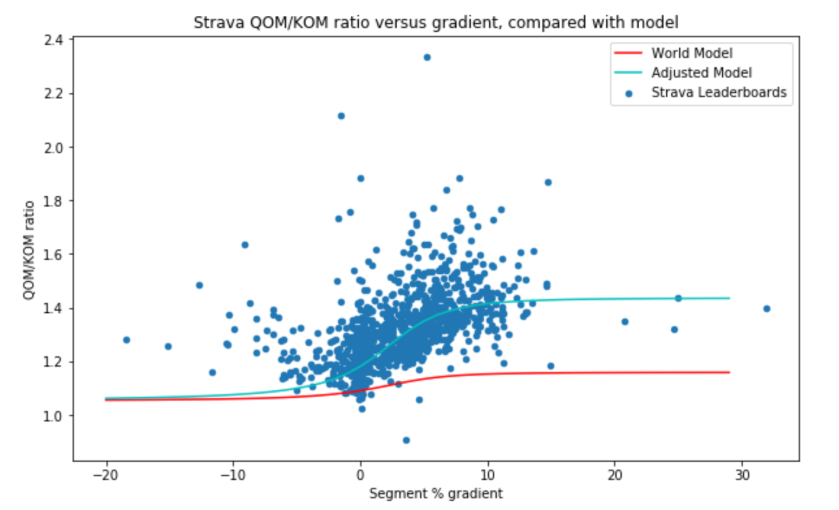
The average segment length was just under 2km, up a gradient of 3%. The following chart plots the ratio of the QOM time to the KOM time versus gradient compared with the model described above. The red line is based on the lean body mass/world record holders estimate of 1.13, whereas the average QOM/KOM ratio was 1.32. Although there is a perceivable upward slope in the data for positive gradients, clearly this does not fit the data.
Screen Shot 2017-11-09 at 17.54.43

Firstly, the points on the left hand side indicate that men go downhill much more fearlessly than women, suggesting a psychological explanation for the observations deviating from the model. To make the model fit better for positive gradients, there is no obvious reason to expect the weight ratio of male to female Strava riders to deviate from the general population, so this leaves only the relative power to weight ratio. According to the model the QOM/KOM ratio should level off to the power to weight ratio for steep gradients. This seems to occur for a value of around 1.40, which is much higher than the previous estimates of 1.13 or the 1.21 for untrained people. How can we explain this?

A notable feature of the data set was that sample of 1,000 Strava segments was completed by nearly eight times as many men as women. This, in turn reflects the facts that there are more male than female cyclists in the UK and that men are more likely to upload, analyse, publicise and gloat over their performances than women.

Having more men than women, inevitably means that the sample includes more high level male cyclists than equivalent female cyclists. So we are not comparing like with like. Referring back to the Training Peaks table of expected power to weight ratios, a figure of 1.40 suggests we are comparing women of a certain level against men of a higher category, for example, “very good” women against “excellent” men.

A further consequence of having far more men than women is that is much more likely that the fastest times were recorded in the ideal conditions described in my previous blogs listed earlier.

Conclusions

There is room for more women to enjoy cycling and this will push up the standard of performance of the average amateur rider. This would enhance the sport in the same way that the industry has benefited as more women have joined the workforce.
Going for a QOM on Strava

In exploring how to chase a KOM on Strava, this series of articles has fallen into the trap of under-representing the achievements of the Queens of the Mountains (QOMs). Although this is partly because Strava tends to attract male data geeks, there are plenty of women who use the platform to monitor their fitness and performance in a social way. This blog looks at the performance of women cyclists, once again featuring the popular Tour de Richmond Park segment.

More women are riding their bikes as the interest in women’s cycling continues to grow. Top riders like Lizzie Deignan, Marianne Vos and the Drops Cycling Team are receiving broader recognition for their amazing performances. This year’s Women’s Tour will benefit from broad media coverage, as it finishes in the heart of London. The Cycling Podcast Féminin is now into its ninth episode.

Analysis of the top 1000 (mostly male) riders on the Tour de Richmond Park leaderboard established that the majority of personal bests (PBs) were set during the summer months, either early in the morning or in the evening, with Saturday and Wednesday being popular days or the week, especially when the wind was blowing from the East. The charts below compare these statistics from the male and female leaderboards.

This slideshow requires JavaScript.

Female PBs are a little more evenly spread over the year, peaking in July. Women have tended to achieve their best times later in the morning, perhaps reflecting a stronger preference for cycling around the park on the weekend, particularly on Sunday, when men seem to be off chasing KOMs elsewhere.

An Easterly wind has also been helpful, though the effect has been less marked than for the men. In fact only three out of the top 25 women benefited from a favourable wind direction. This suggests that, as the weather warms up, there’s an opportunity to post a very good time when there is a strong tailwind up Sawyers Hill, perhaps seeing the first woman under sixteen minutes for the segment. So watch the forecast and get out there girls!

The last post noted that riders can be classified according to their strengths as sprinters, climbers or time trialers. Whatever kind of rider you are, it is important to balance dietary energy intake with exertion. Given the non weight-bearing nature of the sport, this is particularly important for very lean female cyclists, who may experience disruption of hormonal function, resulting in reduced bone mineral density. See Nicky Keay’s blog for more information on Relative Energy Deficiency in Sport, which is also relevant to men and young athletes.

No discussion of Strava QOMs could fail to mention the incredible performance of Maryka Sennema. Her dedication to training and cycling at the highest level has earned her over 2,200 QOMs, making her the undisputed Goddess of the Mountains.

The next blog will continue to apply the scientific microscope to cycling data, in search of helpful insights on pro cyclists.

The best rider for a Strava KOM

So far this series of article has explored to the time of year, wind and weather conditions when riders have set their best times on the Strava leaderboard, using the popular Tour of Richmond Park segment as a case study. This blog considers how the attributes of the cyclist affect the time to complete a segment. The most important components are power, bodyweight and aerodynamic drag area or CdA. Your best chance of picking up a KOM is to target a segment that matches your strengths as a cyclist.

A power curve plots the maximal power a cyclist can sustain over a range of time periods. Ideally, the curve is plotted from the results of a series of maximal effort tests performed over times ranging from 5 seconds to an hour. Alternatively, Strava Premium or software such as Training Peaks or Golden Cheetah can generate power curves from a history of power data files. Power can be expressed in Watts or in Watts per kilogram, as in the example below.

GC_PowerCurve

The shape of the power curve reveals a lot about the characteristics of the cyclist. Dr Andrew Coggan explains how this information can be used to define a cyclist’s individual power profile. In the chart above, the 5 minute and functional threshold (1 hour) Watts/kg rank more highly than 5 second and 1 minute figures, indicating that this cyclist can generate fairly high power for long periods, but has a relatively weaker sprint. For a heavier rider this profile would be consistent with a time trialer, who can generate a high absolute number of Watts, whereas a light rider with this profile may be a better climber, due to a good sustainable power to weight ratio.

If you have a power meter or access to a Wattbike, it is well worth gathering this data for yourself. It can help with training, racing or selecting Strava segments where you have the best chance of moving up the leaderboard.

The power required to maintain a constant speed, V,  needs to balance the forces acting on a rider. Aerodynamic drag is due to the resistance of pushing the rider and bike frame through the air, with some additional drag coming from the rotating wheels. Drag can be decreased by reducing frontal area and by adopting a streamlined shape, while wearing a skinsuit. Additional mechanical factors are due to gravity, the rolling resistance of the tyres on the road surface and drive chain loss.

Power = Drag Factors * V3 + Mechanical Factors * V

Since the power needed to overcome aerodynamic drag scales with the cube of velocity, it is the dominant factor when riding fast on flat or downhill segments. However, on a climb, where speed is lower, the power required to do work against gravity quickly becomes important, especially for heavier riders.

Consider a rider weighing 60kg, call him Nairo, and another weighing 80kg, say Fabian. Suppose they are cruising along side by side at 40kph. Under reasonable assumptions, Fabian rides at 276 Watts or 3.4 Watts/kg, while Nairo benefits from a smaller frontal area and lower rolling resistance, requiring 230 Watts, though this equates to 3.8 Watts/kg. Reaching a 5% hill, they both increase power by 50%, but now Nairo is riding at 27kph, dropping Fabian, whose extra weight slows him to 26kph. You can experiment with this interactive chart.

Climbers are able to sustain high force on the pedals, taking advantage of their ability to accelerate quickly on the steepest slopes. Time trialers generate high absolute power for long periods, on smoother terrain, while maintaining an aerodynamic tuck. Sprinters have more fast-twitch muscle fibres, producing extremely high power for short periods, while pedalling at a rapid cadence.

The following chart shows the gradient and length of 1364 popular Strava segments from around Britain. Distances range from 93m to 93km, with an average of 2.3km. Gradients are from 21% downhill to 32% uphill (Stanwix Bank Climb).

Plot 22
You should be able to click on the chart (no need to sign up) for an interactive version that allows you to zoom in and display the names of the segments that suit your ability: short segments for sprinters, steep ones for climbers and longer flat ones for TTers. The Tour de Richmond Park segment is 10.8km with an average gradient of zero, so it is no surprise that the KOM is held by an accomplished time trialer.
The next blog takes a look at QOMs. Are women different?

The best weather conditions for a KOM on Strava

This is the third in a series of articles investigating factors that determine the best times on Strava leaderboards, using the popular Tour de Richmond Park segment as a case study. So far we have established that the fastest times have tended to be in the summer, with a decent wind blowing from the East. This blog investigates how atmospheric conditions affect the density of air, which, in turn, determines the aerodynamic drag that a cyclist needs to overcome.

The power required to offset the mechanical forces, of gravity and rolling resistance, increases in proportion to speed, but the power needed to overcome aerodynamic drag rises with the cube of velocity. When riding fast, your effort goes principally into overcoming drag: maintaining a speed of 50kpm requires almost double the power of riding at 40kpm (503/40= 125/64 = 1.95). The aerodynamic drag force is proportional to the density of the air though which a cyclist is pushing both body and bike. So you have a better chance of winning a KOM (or QOM) when the air density is low.

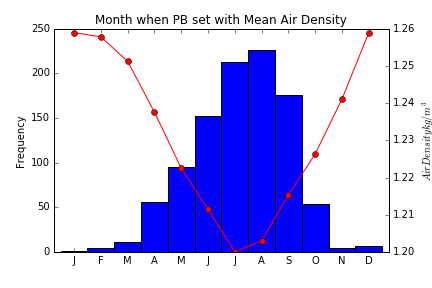
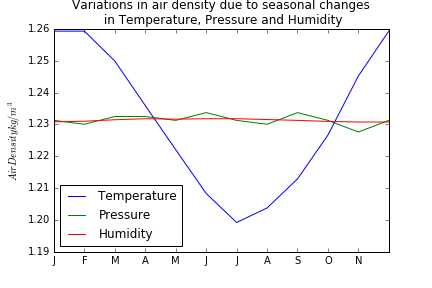
previous blog noted that most personal bests (PBs) on the Richmond Park leaderboard were set in the summer. The following chart superimposes, in red, the average air density in London on a histogram showing the number of PBs set in each month. The trough in the air density implies that aerodynamic drag is about 5% lower during the warmer months.

monthplotrho

So how much difference would a 5% reduction in air density make to your time round Richmond Park? For the same power, the cube of your speed can go up by 5%, resulting in a reduction of your PB time of 1.6%. For example, a cyclist completing a lap of Richmond Park in 16 minutes and 16 seconds (averaging 40kph) in December, would finish in 16 minutes dead, at exactly the same average power, in the less dense air of July. The difference is a second per minute, which equates to a saving of a minute for a one hour TT.

The air density depends on temperature, pressure and humidity. The reason that air density is lower in the summer is that temperatures are higher: warm air expands. Monthly mean atmospheric pressure is pretty much the same all year round. Humidity tends to be higher in the winter. Contrary to what most people think, higher humidity reduces air density (because water vapour, H2O, with a molecular mass of 18, is lighter than the main constituent of air, nitrogen, N2, which has a molecular mass of 28). However, as the following chart shows, changes in humidity have a tiny effect on air density relative to changes in temperature.

drhodtph

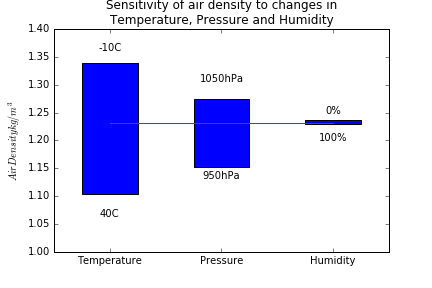
Although temperature is the primary determinant of seasonal variations in air density, both atmospheric pressure and humidity can vary significantly from day to day, so it is important to consider these factors when aiming for a KOM. The next chart shows the variability of air density, measured on a particular day, for an extreme range of temperatures, pressures and humidities.

rangerho

When Bradley Wiggins was going for the hour record, he became obsessed with the weather forecast, because even though it was possible to raise the temperature and humidity in the velodrome, he ideally needed a low pressure weather system to pass over the UK at the same time, as this would have further reduced the density of the air that he was riding through. On 2 May 2015, the air pressure in Manchester, which is close to sea level, was 1009hPa. If it had been about 3% lower, at say 980hPa (historically very low), he should have been able to go about 1% further, to exceed 55km.

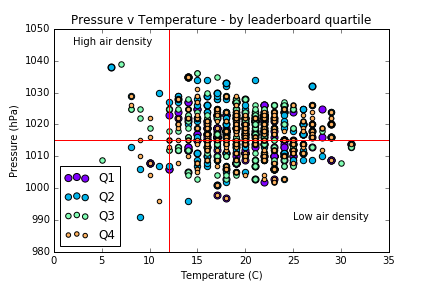
Since Strava segments tend to be outdoors, your priority should be to choose a very warm day, ideally with low atmospheric pressure and not worry too much about humidity, though higher is better. Returning to the leaderboard for the Tour de Richmond Park segment, the final chart shows the temperature and pressure on the days that the top 1000 PBs were set, split into quartiles of 250 riders (fastest riders in Q1).

pvt

Observe that most records were set when the temperature was well above the annual mean of 12 °C, shown by the vertical red line. Slightly more PBs were set when the atmospheric pressure was disadvantageously higher than the average horizontal red line. There was no significant difference in air density for the top 250 riders versus the other groups of 250. Clearly the best place to be is the lower right quadrant. Finally, we have found something that would have allowed Rob Sharland to improve upon his KOM, as the prevailing conditions were 21 °C and 1022hPa – a warmer day with a lower atmospheric pressure would have helped him go faster – but then he might not have had the ideal wind conditions noted in the previous blog. The relative importance of wind versus air density is something I hope to come back to.

The next blog explores the factors relating to the rider and bike that influence the time to complete a Strava segment.

The best wind for a KOM on Strava

Two key aspects of the weather influence the time to complete a Strava segment: the wind and the air density. This blog considers the direction and speed of the wind. The following blog will examine how aerodynamic drag is affected by changes in air density.

Clearly, on an exposed, arrow-straight segment, the most favourable weather would be a hurricane tailwind. Like other KOM hunters, I have searched for segments that align with the predicted wind direction when a gale is forecast, though I’ve usually ended up going kitesurfing instead.

When the segment is a loop, such as the Tour de Richmond Park, discussed in the previous blog, the question becomes more interesting. Consider a light aircraft flying above the Richmond Park segment at an altitude of 300m. Any constant wind, regardless of direction, will result in a slower time than completing the circuit in still air. Why? Since any headwind slows down the plane, it hinders the pilot for more time than the tailwind provides assistance, resulting in a net increase in the total time.

However, cyclists do not ride in constant winds. Trees, buildings and the terrain all affect the wind’s speed and direction. Variability is so strong that it is recommended that multiple anemometers should be positioned at intervals alongside the 100m track at important athletics meetings.

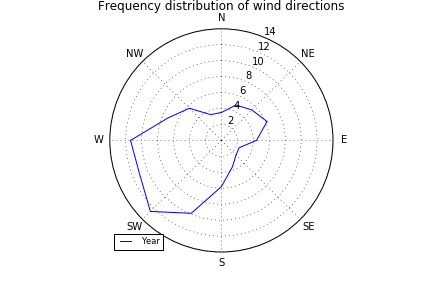
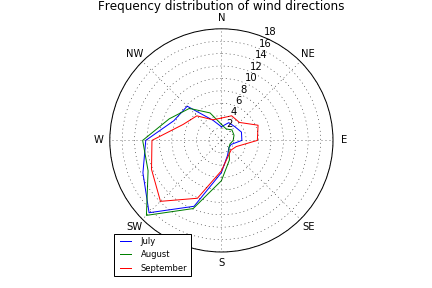
All this means that it is quite likely that there are optimal wind conditions for all Strava segments. Most people suggest that a tailwind up Sawyers Hill is best for Richmond Park, as this part of the segment is an uphill drag that is exposed to the wind, whereas other sections of the route are much more sheltered. The bearing of a tailwind would be from just North of Easterly.  Historically, this is not a very common wind direction for London. The following charts shows the prevailing wind direction over the year is Southwesterly.

roseyear

Easterly winds are even rarer in July and August, when many PBs have been set, though in September they have been a little more frequent. (An interactive version of the chart can be found on this site.)

rosesummer

Now, if the wind had no effect on the Strava segment, we would expect the distribution of wind directions on which riders set their PBs to be similar to the historic distribution. So we are interested in the difference between the distribution of wind directions on the dates derived from the leaderboard relative the background average. The following chart compares the segment against the historic average annual average. The compass rose clearly shows a much higher frequency (13%) of the PBs of the top 1000 riders were set when the wind was blowing from the East and a relatively lower incidence in the opposite direction.

rosesegment

The next hand chart “unwraps” the two curves to show the relative difference, which is statistically highly significant (p<0.01). A forensic analysis of the data confirms that the best wind direction for a PB around Richmond Park is indeed an Easterly tailwind up Sawyers Hill.

barsegment

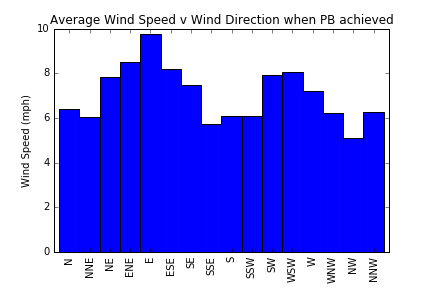
So far we have not considered the strength of the wind. The next chart shows the average windspeed on the days that PBs were set, according to the direction of the wind. This shows a bias towards stronger winds from the East, consistent with the frequency of PBs.

windspeedbydirn

Combining this with the results of the previous blog, the following conclusions may be drawn. However good a cyclist you are, your best chance of achieving a high ranking on the Tour de Richmond Park leaderboard is to choose the evening or morning of one of the rare summer days when the wind is blowing strongly from the East. And, you guessed it, on the evening of August 2015 when Rob Sharland achieved his KOM, the wind was blowing at 11mph on a bearing of 80° .

The next blog will examine how temperature, pressure and humidity, as well as altitude, change the air’s density. This is the principal environmental factor affecting your aerodynamic drag, when you are going for a KOM.

When to go for a KOM on Strava

The dates and times that people achieved their PBs on the Tour de Richmond Park

As the number of cyclists using Strava continues to grow, it is becoming increasingly difficult to achieve a high ranking on the leaderboard of any popular segment. Whilst it is possible to hunt for a top performance on some obscure route, attaining a KOM (or QOM) on a segment attempted by tens of thousands of other athletes is a real challenge.

Consider the Tour de Richmond Park, in southwest London. On 17 February 2017, the leaderboard had 35,833 entries. Note that the leaderboard does not show the 35,833 fastest times, rather it displays the personal best (PB) times of 35,833 individuals – it doesn’t matter how many times you do the segment, you only have one entry on the leaderboard. The current KOM is held by Rob Sharland, who completed the 10.8km segment in 13 minutes 57 seconds.

The top 1,000 entries on the leaderboard reveal some interesting patterns. This initial blog explores the dates and times that people achieved their PBs. The first striking observation is that hardly anyone sets a PB during the winter. The following chart shows that most records were set between June and September.

monthplot

This suggests that riders tend to be in better form in the summer and that conditions are more favourable. In fact, it turns out that hours of daylight play an important role, as demonstrated by the following chart showing that most PBs are set either in the evening, around 7pm or in the early morning, between 6am and 9am. These represent times before or after work, when car traffic is lighter. Very few records are set in during the middle of the day and none at night.

hourplot

A look at the days of the week, when record are set, reveals that Wednesday and Saturday are particularly popular. It turns out the most Wednesday records were achieved in the evening with some in morning, whereas almost all Saturday records were completed by 10am.

weekplot

So the best time to achieve a PB around Richmond Park is on a Wednesday evening in August. And it turns out that Rob Sharland set the KOM at 8:31pm on Wednesday 12 August 2015.

But Rob deserves additional kudos, because quite a few riders have set their personal bests riding in groups, whereas it looks like Rob was riding solo. Nine other riders set their PBs on the same day, but these were all earlier than Rob’s. There were three other dates on which 10 or more riders achieved their fastest times. It is easy to spot those riding as a group, because they all start together and finish with similar times (show in red here). So chapeau to Rob for beating them all.

The next blog explores the prevailing weather conditions.