Dreaming of the Giro

fast.ai’s latest version of Practical Deep Learning for Coders Part 2 kicks off with a review of Stable Diffusion. This is a deep neural network architecture developed by Stability AI that is able to convert text into images. With a bit of tweaking it can do all sorts of other things. Inspired by the amazing videos created by Softology, I set out to generate a dreamlike video based on the idea of riding my bicycle around a stage of the Giro d’Italia.

Text to image

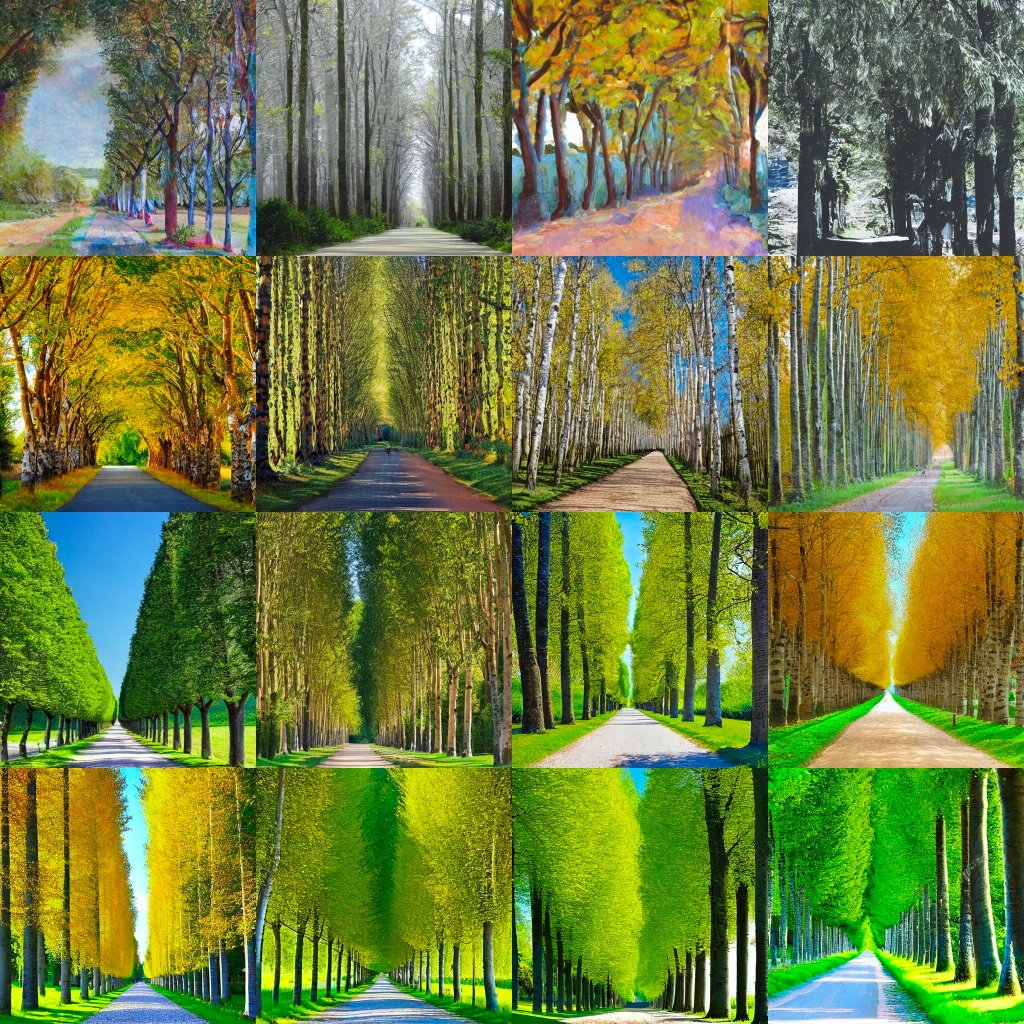
As mentioned in a previous post, Hugging Face is a fantastic resource for open source models. I worked with one of fast.ai’s notebooks using a free GPU on Google Colab. In the first step I set up a text-t0-image pipeline using a pre-trained version of stable-diffusion-v1-4. The prompt “a treelined avenue, poplars, summer day, france” generated the following images, where model was more strongly guided by the prompt in each row. I liked the first image in the second row, so I decided to make this the first frame in an initial test video.

Stable diffusion is trained in a multimodal fashion, by aligning text embeddings with the encoded versions corresponding images. Starting with random noise, the pixels are progressively modified in order to move the encoding of the noisy image closer to something that matches the embedding of the text prompt.

Zooming in

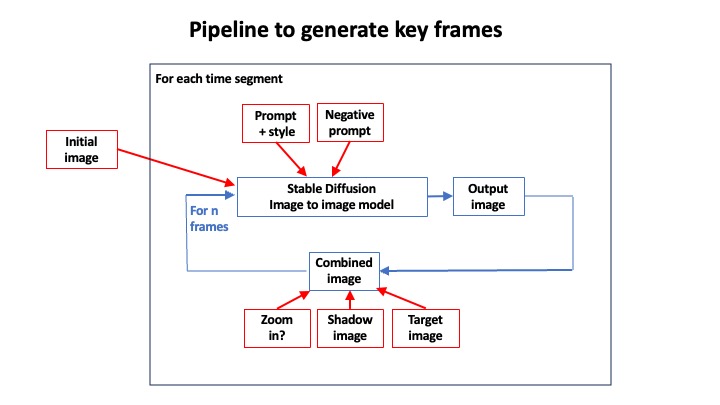
The next step was to simulate the idea of moving forward along the road. I did this by writing a simple two-line function, using fast.ai tools, that cropped a small border off the edge of the image and then scaled it back up to the original size. In order to generate my movie, rather that starting with random noise, I wanted to use my zoomed-in image as the starting point for generating the next image. For this I needed to load up an image-to-image pipeline.

I spent about an hour experimenting with with four parameters. Zooming in by trimming only a couple of pixels around the edge created smoother transitions. Reducing the strength of additional noise enhanced the sense of continuity by ensuring that that subsequent images did not change too dramatically. A guidance scale of 7 forced the model to keep following prompt and not simply zoom into the middle of the image. The number of inference steps provided a trade-off between image quality and run time.

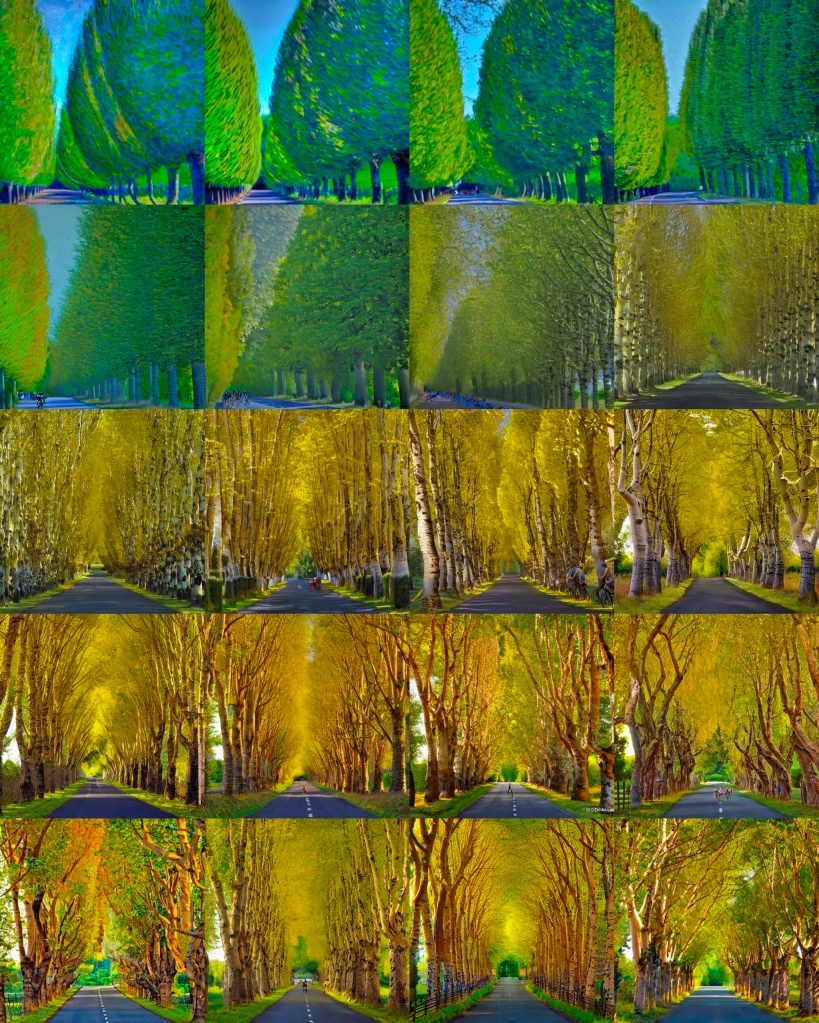
When I was happy, I generated a sequence of 256 images, which took about 20 minutes, and saved them as a GIF. This produced a pleasing, constantly changing effect with an impressionist style.

Back to where you started

In order to make the GIF loop smoothly, it was desirable to find a way to return to the starting image as part of the continuous zooming in process. At first it seemed that this might be possible by reversing the existing sequence of images and then generating a new sequence of images using each image in the reversed list as the next starting point. However, this did not work, because it gave the impression of moving backwards, rather than progressing forward along the road.

After thinking about the way stable diffusion works, it became apparent that I could return to the initial image by mixing it with the current image before taking the next step. By progressively increasing the mixing weight of the initial image, the generated images became closer to target over a desired number of steps as shown below.

Putting it al together produced the following video, which successfully loops back to its starting point. It is not a perfect animation, because the it zooms into the centre, whereas the vanishing point is below the centre of the image. This means we end up looking up at the trees at some points. But overall it had the effect I was after.

A stage of the Giro

Once all this was working, it was relatively straightforward to create a video that tells a story. I made a list of prompts describing the changing countryside of an imaginary stage of the Giro d’Italia, specifying the number of frames for each sequence. I chose the following.

[‘a wide street in a rural town in Tuscany, springtime’, 25],

[‘a road in the countryside, in Tuscany, springtime’,25],

[“a road by the sea, trees on the right, sunny day, Italy”,50],

[‘a road going up a mountain, Dolomites, sunny day’,50],

[‘a road descending a mountain, Dolomites, Italy’,25],

[‘a road in the countryside, cypress trees, Tuscany’,50],

[‘a narrow road through a medieval town in Tuscany, sunny day’,50]

These prompts produced the video shown at the top of this post. The springtime blossom in the starting town was very effective and the endless climb up into the sunlit Dolomites looked great. For some reason the seaside prompt did not work, so the sequence became temporarily stuck with red blobs. Running it again would make something different. Changing the prompts offered endless possibilities.

The code to run this appears on my GitHub page. If you have a Google account, you can open it directly in Colab and set the RunTime to GPU. You also need a free Hugging Face account to load the stable diffusion pipelines.

Percolating Python with ChatGPT

A YouTube video about “percolation” includes an interesting animation of shifting colours that exhibits a sudden phase transition. As a challenge, I set out to replicate the evolving pattern in Python. But then I remembered hearing that ChatGPT was good at writing code, so I asked it for help

Percolation

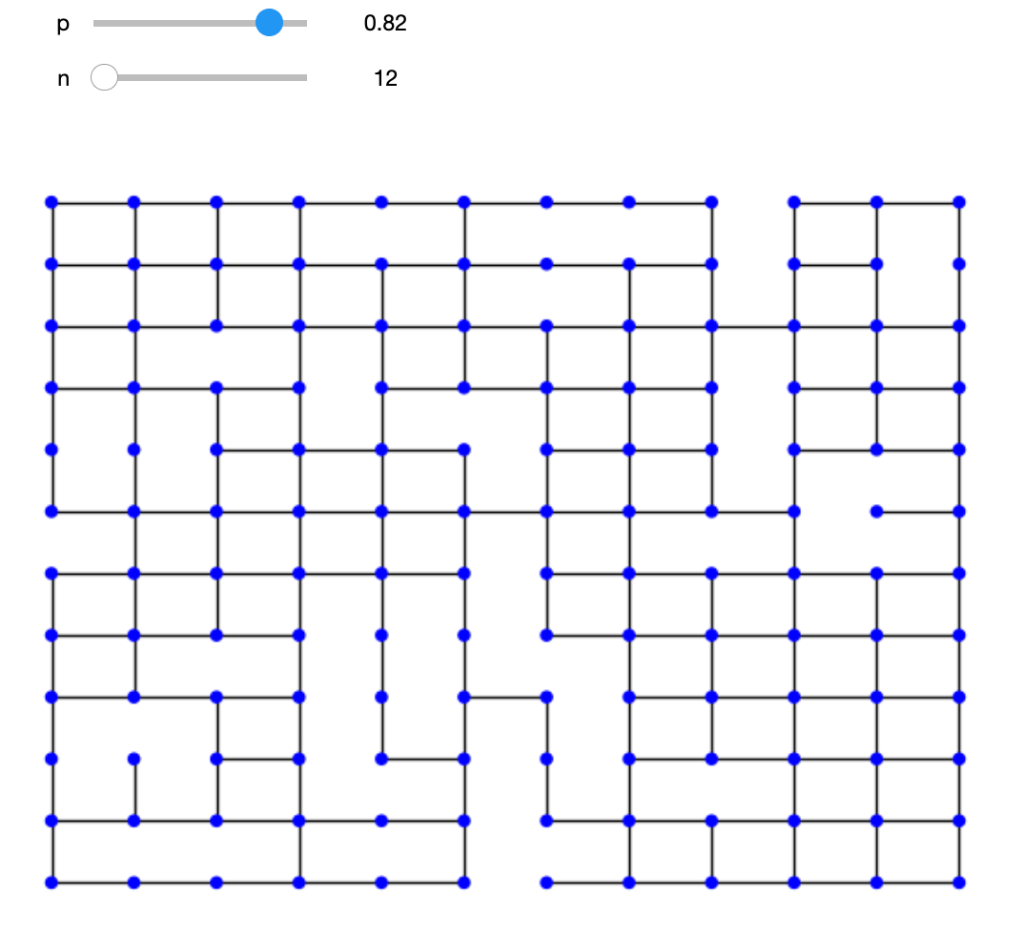
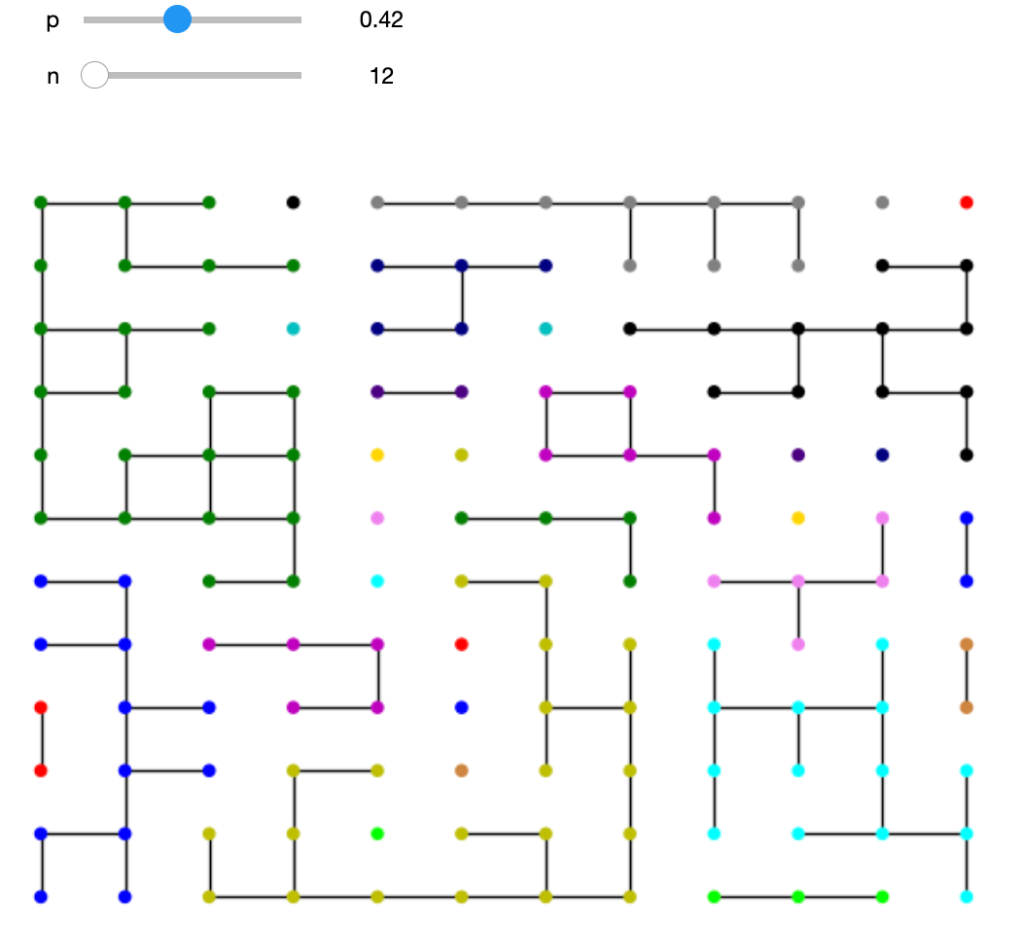
Percolation models can be used to simulate physical systems, such as liquids permeating through porous materials. The idea is to take a grid pattern of nodes with edges between them, and then remove edges at random. Each edge survives with a probability, p. If the edges were pipes, we could imagine that water could percolate through a well-connected grid (image on the left), but, as more edges are removed, the nodes form connected islands that prevent onward percolation (image on the right).

Asking ChatGPT

I started by asking ChatGPT to model a randomly connected lattice in Python. It suggested using a library called networkx that I have used in the past, so I pasted the code into a Jupyter notebook. The code worked, but the nodes were scattered at random, so I asked ChatGPT for code to produce a regular grid. This failed, so I passed the error message back to ChatGPT, which explained the problem and suggested revised code that worked perfectly, producing something like the left hand image above.

The next step was to apply the same colour to all connected nodes. Initially I called these clusters, but then I discovered that networkx has a method called connected_components, so I substituted this into ChatGPT’s code. After about half an hour, I had added more colours and some ipywidget sliders, to produce a fully working interactive model, where I could vary p and adjust the size of the grid.

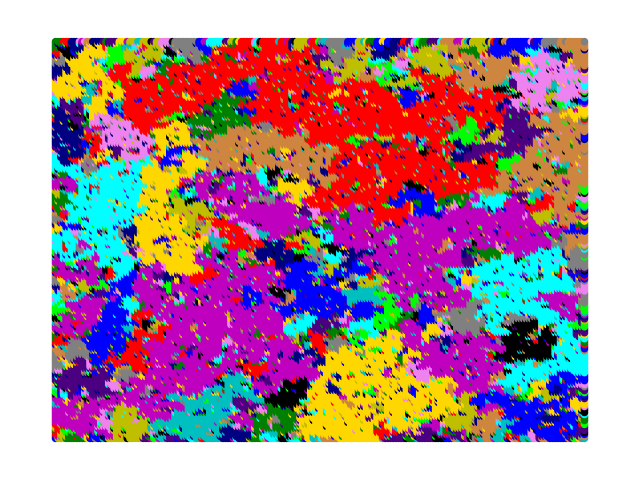
The really interesting behaviour happens when p is around 0.5. Below this value the grid tends to form a disjoint set of unconnected islands, but above the critical value, the large areas quickly connect up. This image at the top of this blog occurs around the middle of the video below.

Percolation Model

Python code

This is the code if you want to try it yourself. You might need to pip install networkx and ipywidgets.

import networkx as nx
import numpy as np
import matplotlib.pyplot as plt
import random
from ipywidgets import interact

def randomLattice(p=0.5, n = 100):
    # Square grid m=n
    m=n
    # Create a 2D grid of nodes using NumPy
    nodes = np.array([(i, j) for i in range(m) for j in range(n)])

    # Convert the NumPy array to a list of tuples
    nodes = [tuple(node) for node in nodes]

    # Create an empty graph
    G = nx.Graph()

    # Add nodes to the graph
    G.add_nodes_from(nodes)

    # Connect adjacent nodes horizontally
    for i in range(m):
        for j in range(n-1):
            if random.random() < p:  # adjust the probability to control the connectivity
                G.add_edge((i, j), (i, j+1))

    # Connect adjacent nodes vertically
    for i in range(m-1):
        for j in range(n):
            if random.random() < p:  # adjust the probability to control the connectivity
                G.add_edge((i, j), (i+1, j))


    clusters = list(nx.connected_components(G))
    colours = ["b", "r", "g", "y", "m", "c", "k",'lime','cyan','violet','gold','indigo','navy','grey','peru']
    node_to_colour = {}
    for i, cluster in enumerate(clusters):
        for node in cluster:
            node_to_colour[node] = colours[i%len(colours)]
    #print(clusters)
    # Draw the graph as a regular grid
    pos = dict(zip(nodes, nodes))
    nx.draw(G, pos=pos, node_color=[node_to_colour[i] for i in nodes], 
            with_labels=False,node_size=20)
    #plt.savefig(f'Grid_{int(p*100):03d}.png')
    plt.show()
    return


interact(randomLattice,p=(0,1,0.01), n = (5,200,1));

Sword in the stone

The project began by building the sword from scratch. Following a series of clearly explained steps, a basic cube was stretched and reshaped until it took the form of a blade. Adding a metallic material complete with subtle scratches and blemishes enhanced its realism. Clever use of mirror symmetry ensured that the handle and pommel were perfectly balanced. The handle was decorated a leather texture. In the next step the blade and pommel were imbued with light emitting runes.

The sword was embedded in some rocks designed to look like a plinth with two small steps. The rock were positioned to create leading lines towards the sword handle. A rocky background gave the impression of being inside a cave. This was achieved by randomly scattering rocks onto the tessellated faces of a partial hemisphere and fiddling with the density parameter.

Although Blender includes a range of particle simulators, this project used geometry nodes to create the flames, embers and floating particles, adding dramatic effect to the sword.

Having constructed the elements of the scene, considerable time was spent on lighting and volumetric effects, with the aim of creating depth and realism. For example, randomly positioning shapes, called gobos, in front of the spotlights created patches of light and shade in the beams, helping to highlight important elements, like the handle of the sword. Making the spotlights the children of their targets ensured that they moved synchronously. Another step, called compositing, was used to generate an ethereal vignette and adjust the colour balance between foreground and background.

The next step introduced cameras to create the final animation. Once the key frames were positioned in the dope sheet, Blender automatically panned the camera around the scene. Further spectacle was added to the setting by importing a free motion captured character from the fantastic Mixamo site.

Having completed the tutorial, I extended the animation, slowed it down to half speed and added some of my own music to produce the final video. One of the reasons for embarking on the project was to test out the power of the GPUs on my new MacBook Pro. It did not disappoint, rendering the entire video at lightning speed.

In a future project, I plan to experiment with Blender’s Python API.

Hugging Face

I have been blown away exploring Hugging Face. It’s a community on a mission “to democratize good machine learning”. It provides access to a huge library of state-of-the-art models. So far I have only scratched the surface of what is available, but this blog gives a sample of things I have tried.

At the time of writing, there were 128,463 pre-trained models covering a huge range of capabilities, including computer vision, natural language processing, audio, tabular, multimodal and reinforcement models. The site is set up to make it incredibly easy to experiment with a demo, download a model, run it in a Jupyter notebook, fine-tune it for a specific task and then add it to the space of machine learning apps created by the community. For example, an earlier blog describes my FilmStars app.

Computer vision with text

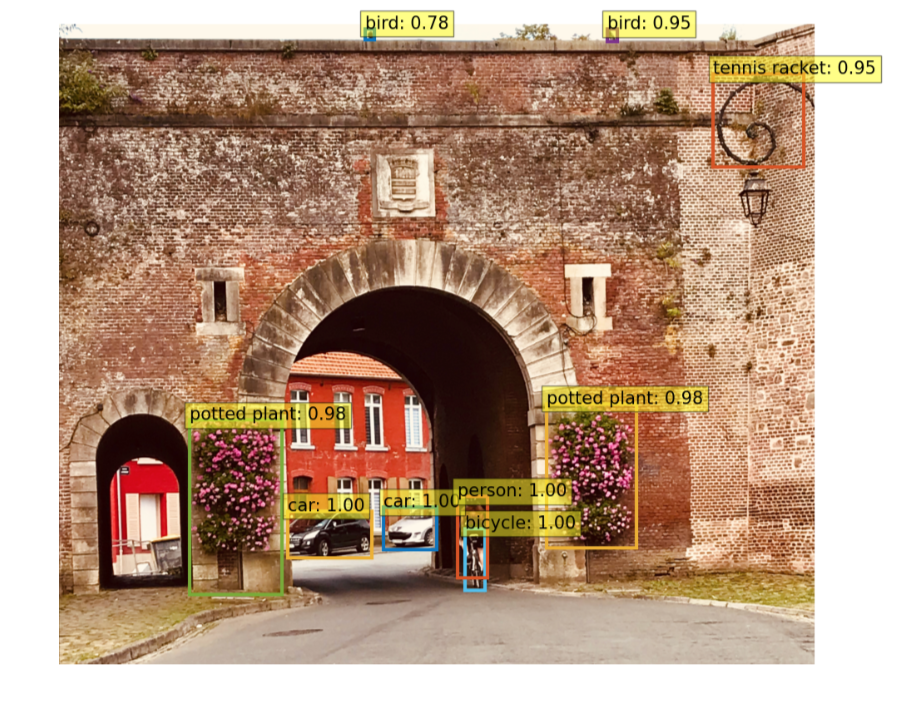
This is an example from an app that uses the facebook/detr-resnet-50 model to identify objects in an image. It successfully located eight objects with high confidence (indicated by the numbers), but it was fooled into thinking part of the curved lamppost in front of the brickwork pattern was a tennis racket (you can see why).

Image-to-text models go further by creating captions describing what is in the image. I used an interactive demo to obtain suggested captions from a range of state-of-the-art models. The best result was produced by the GIT-large model, whereas a couple of models perceived a clocktower .

These models can also answer questions about images. Although all of the answers were reasonable, GIT-large produced the best response when I asked “Where is the cyclist?”

The next image is an example of text-based inpainting with CLIPSeg x Stable Diffusion, where I requested that wall should be replaced with an apartment block. The model successfully generated a new image while preserving the cyclist, flowers, arch, background and even the birds on the roof. I had great fun with this app, imagining what my friend’s house will look like, when it eventually emerges from a building site.

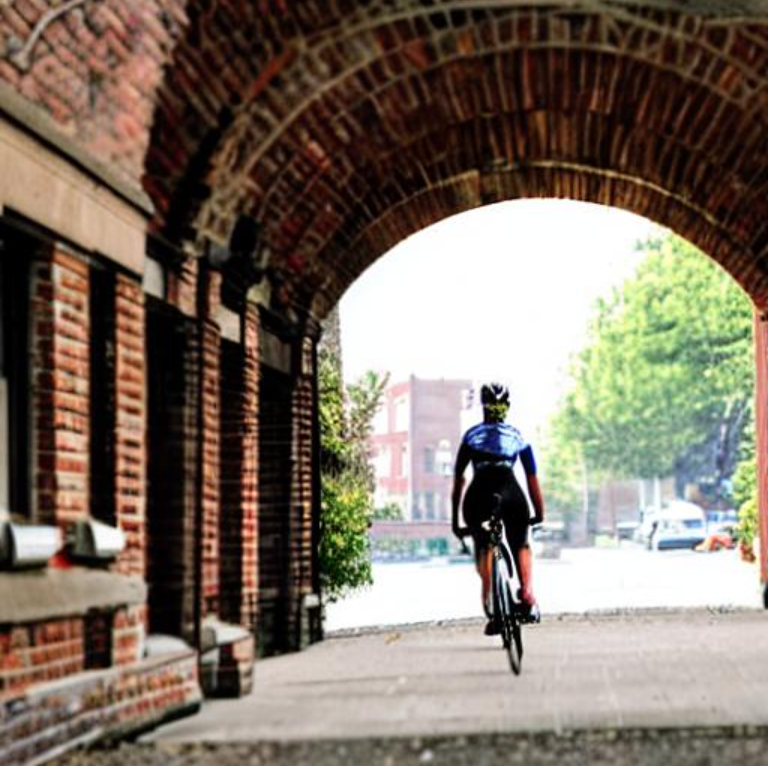
Continuing with the theme of image generation, I reversed the image to caption problem, by asking a stable-diffusion-v1-5 model to generate an image from the caption “a cyclist rides away through an old brick archway in a city”. It came up with an image remarkably similar to what we started with, even including a female cyclist.

Do it yourself

HuggingFace provides various ways for you to download any of the models from its library. The easiest way to do this is to set up a free account on kaggle, which offers a Jupyter notebook environment with access to a GPU.

Using a HuggingFace pipeline, you can run a model with three lines of Python code! Pipelines can be set up for the image models above, but this is an example of the code required to run a text-based natural language processing task. It creates and runs a pipeline that summarises text, using a model specifically trained to generate output in the style of SparkNotes.

from transformers import pipeline
summarizer = pipeline("summarization",model="pszemraj/long-t5-tglobal-base-16384-book-summary")
summarizer("""Sample text from a book...""")

This rather morbid sample text produced the output from Python that follows.

The fact that Henry Armstrong was buried did not seem to him to prove that he was dead: he had always been a hard man to convince. That he really was buried, the testimony of his senses compelled him to admit. His posture — flat upon his back, with his hands crossed upon his stomach and tied with something that he easily broke without profitably altering the situation — the strict confinement of his entire person, the black darkness and profound silence, made a body of evidence impossible to controvert and he accepted it without cavil.

But dead — no; he was only very, very ill. He had, withal, the invalid’s apathy and did not greatly concern himself about the uncommon fate that had been allotted to him. No philosopher was he — just a plain, commonplace person gifted, for the time being, with a pathological indifference: the organ that he feared consequences with was torpid. So, with no particular apprehension for his immediate future, he fell asleep and all was peace with Henry Armstrong.

But something was going on overhead. It was a dark summer night, shot through with infrequent shimmers of lightning silently firing a cloud lying low in the west and portending a storm. These brief, stammering illuminations brought out with ghastly distinctness the monuments and headstones of the cemetery and seemed to set them dancing. It was not a night in which any credible witness was likely to be straying about a cemetery, so the three men who were there, digging into the grave of Henry Armstrong, felt reasonably secure.

From One Summer Night by Ambrose Bierce
[{'summary_text': "Henry's body is buried in the cemetery, but it does not seem to make him any more certain that he is dead. Instead, he seems to be completely ill."}]

Having come this far, it takes only a few steps to fine tune the model to match your desired task, put it into a GitHub repository and launch your own app as a fully fledged member of the Hugging Face community. A nice explanation is available at fast.ai lesson 4.

Active Inference

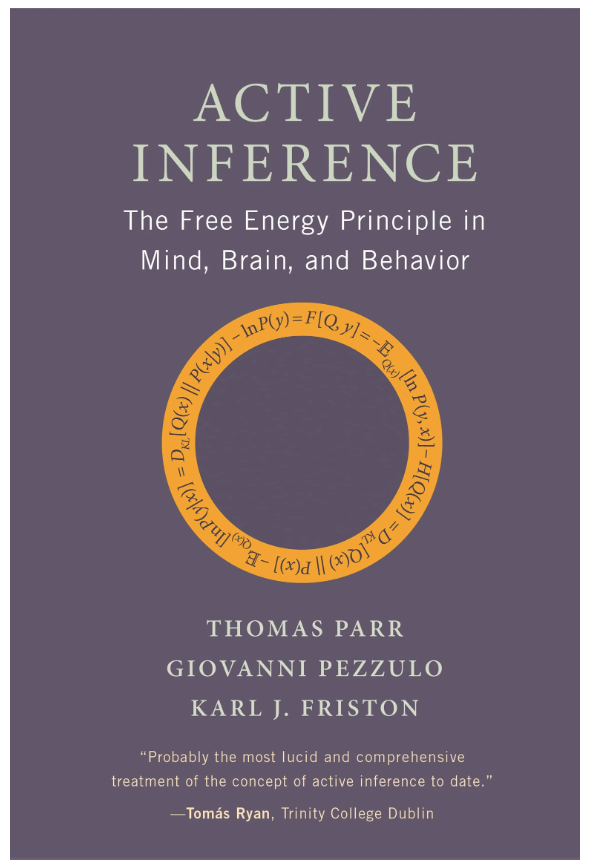
Active Inference is a fascinating and ambitious book. It describes a very general normative approach to understanding the mind, brain and behaviour, hinting at potential applications in machine learning and the social sciences. The authors argue that the ways in which living beings interact with the environment can be modelled in terms of something called the free energy principle.

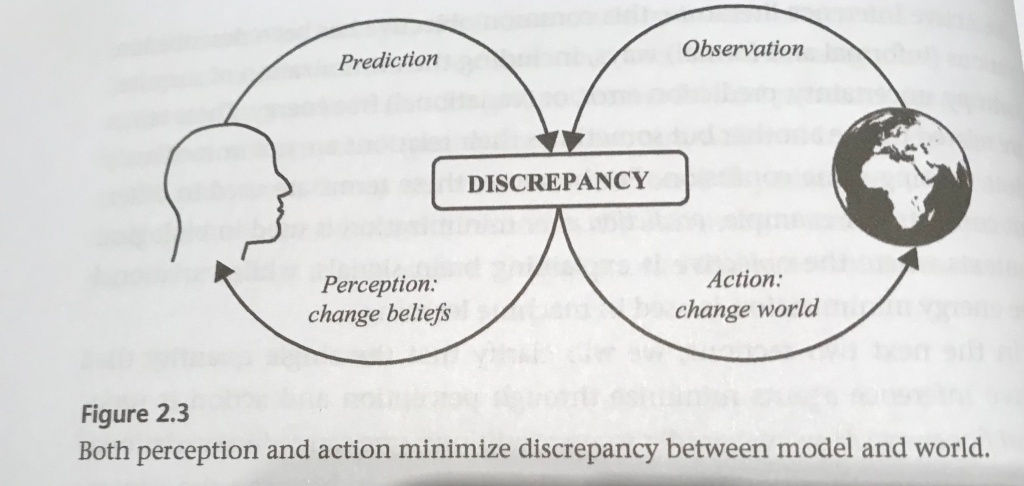
Active Inference builds on the concept of a Bayesian Brain. This is the idea that our brains continually refine an internal model of the external world, acting as probabilistic inference machines. The internal generative model continually predicts the state of the environment and compares its predictions with the inputs of sensory organs. When a discrepancy occurs, the brain updates its model. This is called perception.

But Active Inference goes further my recognising that living things can interact with their environments. Therefore an alternative way to deal with a discrepancy versus expectations is to do something that modifies the world. This is called action.

Variational Free Energy

Active Inference, Parr, Pezzulo, Friston

Either you change your beliefs to match the world or you change the world to match your beliefs. Active Inference makes this trade off by minimising variational free energy, which improves the match between an organism’s internal model and the external world.

The theory is expressed in elegant mathematical terms that lend themselves to systematic analysis. Minimising variational free energy can be considered in terms of finding a maximum entropy distribution, minimising complexity or reducing the divergence between the internal model and the actual posterior distribution.

Expected free energy

Longer term planning is handled in terms of expected free energy. This is where the consequences of future sequences of actions (policies) are evaluated by predicting the outcomes at each stage. The expected free energy of each policy is converted into a score, with the highest score determining the policy the organism expects to pursue. The process of selecting policies that improve the match with the priors pertaining to favoured states is called learning.

Planning is cast in terms of Bayesian inference. Once again the algebraic framework lends itself to a range of interpretations. For example, it automatically trades off information gain (exploration) against pragmatic value (exploitation). This contrasts with reinforcement learning, which handles the issue more heuristically, by trial and error, combined with the notion of a reward.

Applications

The book describes applications in neurobiology, learning and perception. Although readers are encouraged to apply the ideas to new areas, a full understanding of the subject demands the dedication to battle through some heavy duty mathematical appendices, covering Bayesian inference, partially observed Markov Decision Processes and variational calculus.

Nevertheless the book is filled with thought provoking ideas about how living things thrive in the face of the second law of thermodynamics.

Eddy goes to Hollywood

Should Eddy Merckx win an Oscar? Could the boyish looks of Tadej Pogačar or Remco Evenepoel make it in the movies? Would Mathieu van der Poel’s chiselled chin or Wout van Aert strong features help them lead the cast in the next blockbuster? I built a FilmStars app to find out.

https://sci4-filmstars.hf.space

Building a deep learning model

Taking advantage of the fantastic deep learning library provided by fast.ai, I downloaded and cleaned up 100 photos of IMDb’s top 100 male and female stars. Then I used a free GPU on Kaggle to fine-tune a pre-trained Reset50 neural net architecture to identify movie stars from their photos. It took about 2 hours to obtain an accuracy of about 60%. There is no doubt that this model could be greatly improved, but I stopped at that point in the interest of time. After all, 60% is a lot better than the 0.5% obtained from random guessing. Then I used HuggingFace to host my app. The project was completed in two days with zero outlay for resources.

It is quite hard to identify movie stars, because adopting a different persona is part of the job. This means that actors can look very different from one photo to the next. They also get older: sadly, the sex bombs of the ’60s inevitably become ageing actresses in their sixties. So the neural network really had its work cut out to distinguish between 200 different actors, using a relatively small sample of data and only a short amount of training.

Breaking away

Creating the perfect film star identifier was never really the point of the app. The idea was to allow people to upload images to see which film stars were suggested. If you have friend who looks like Ralph Fiennes, you can upload a photo and see whether the neural net agrees.

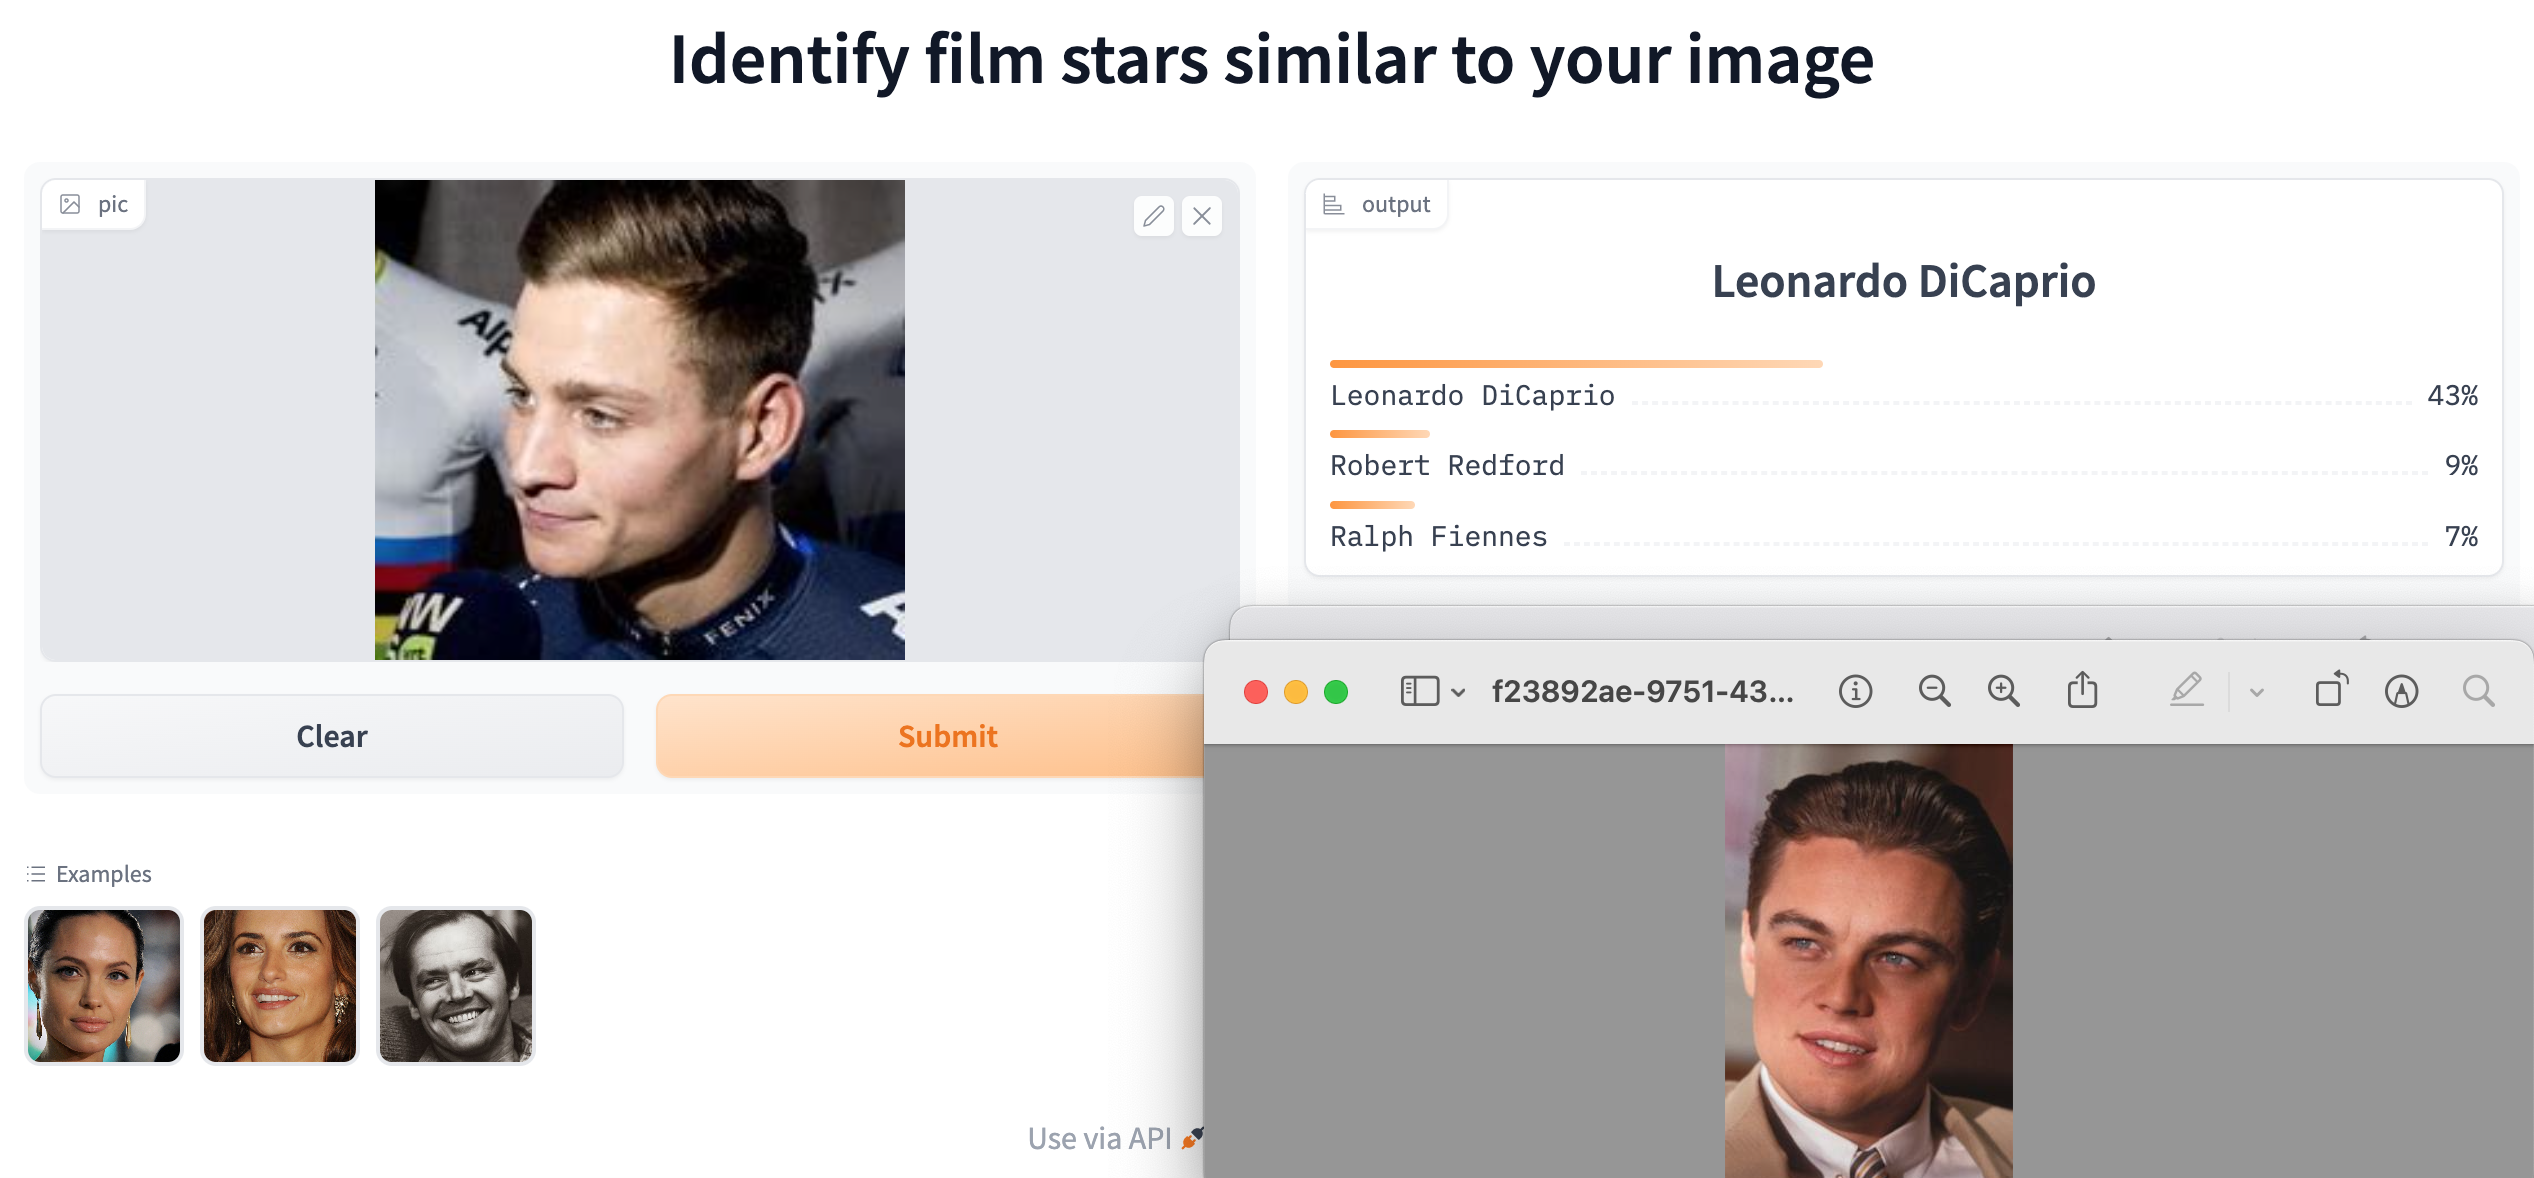
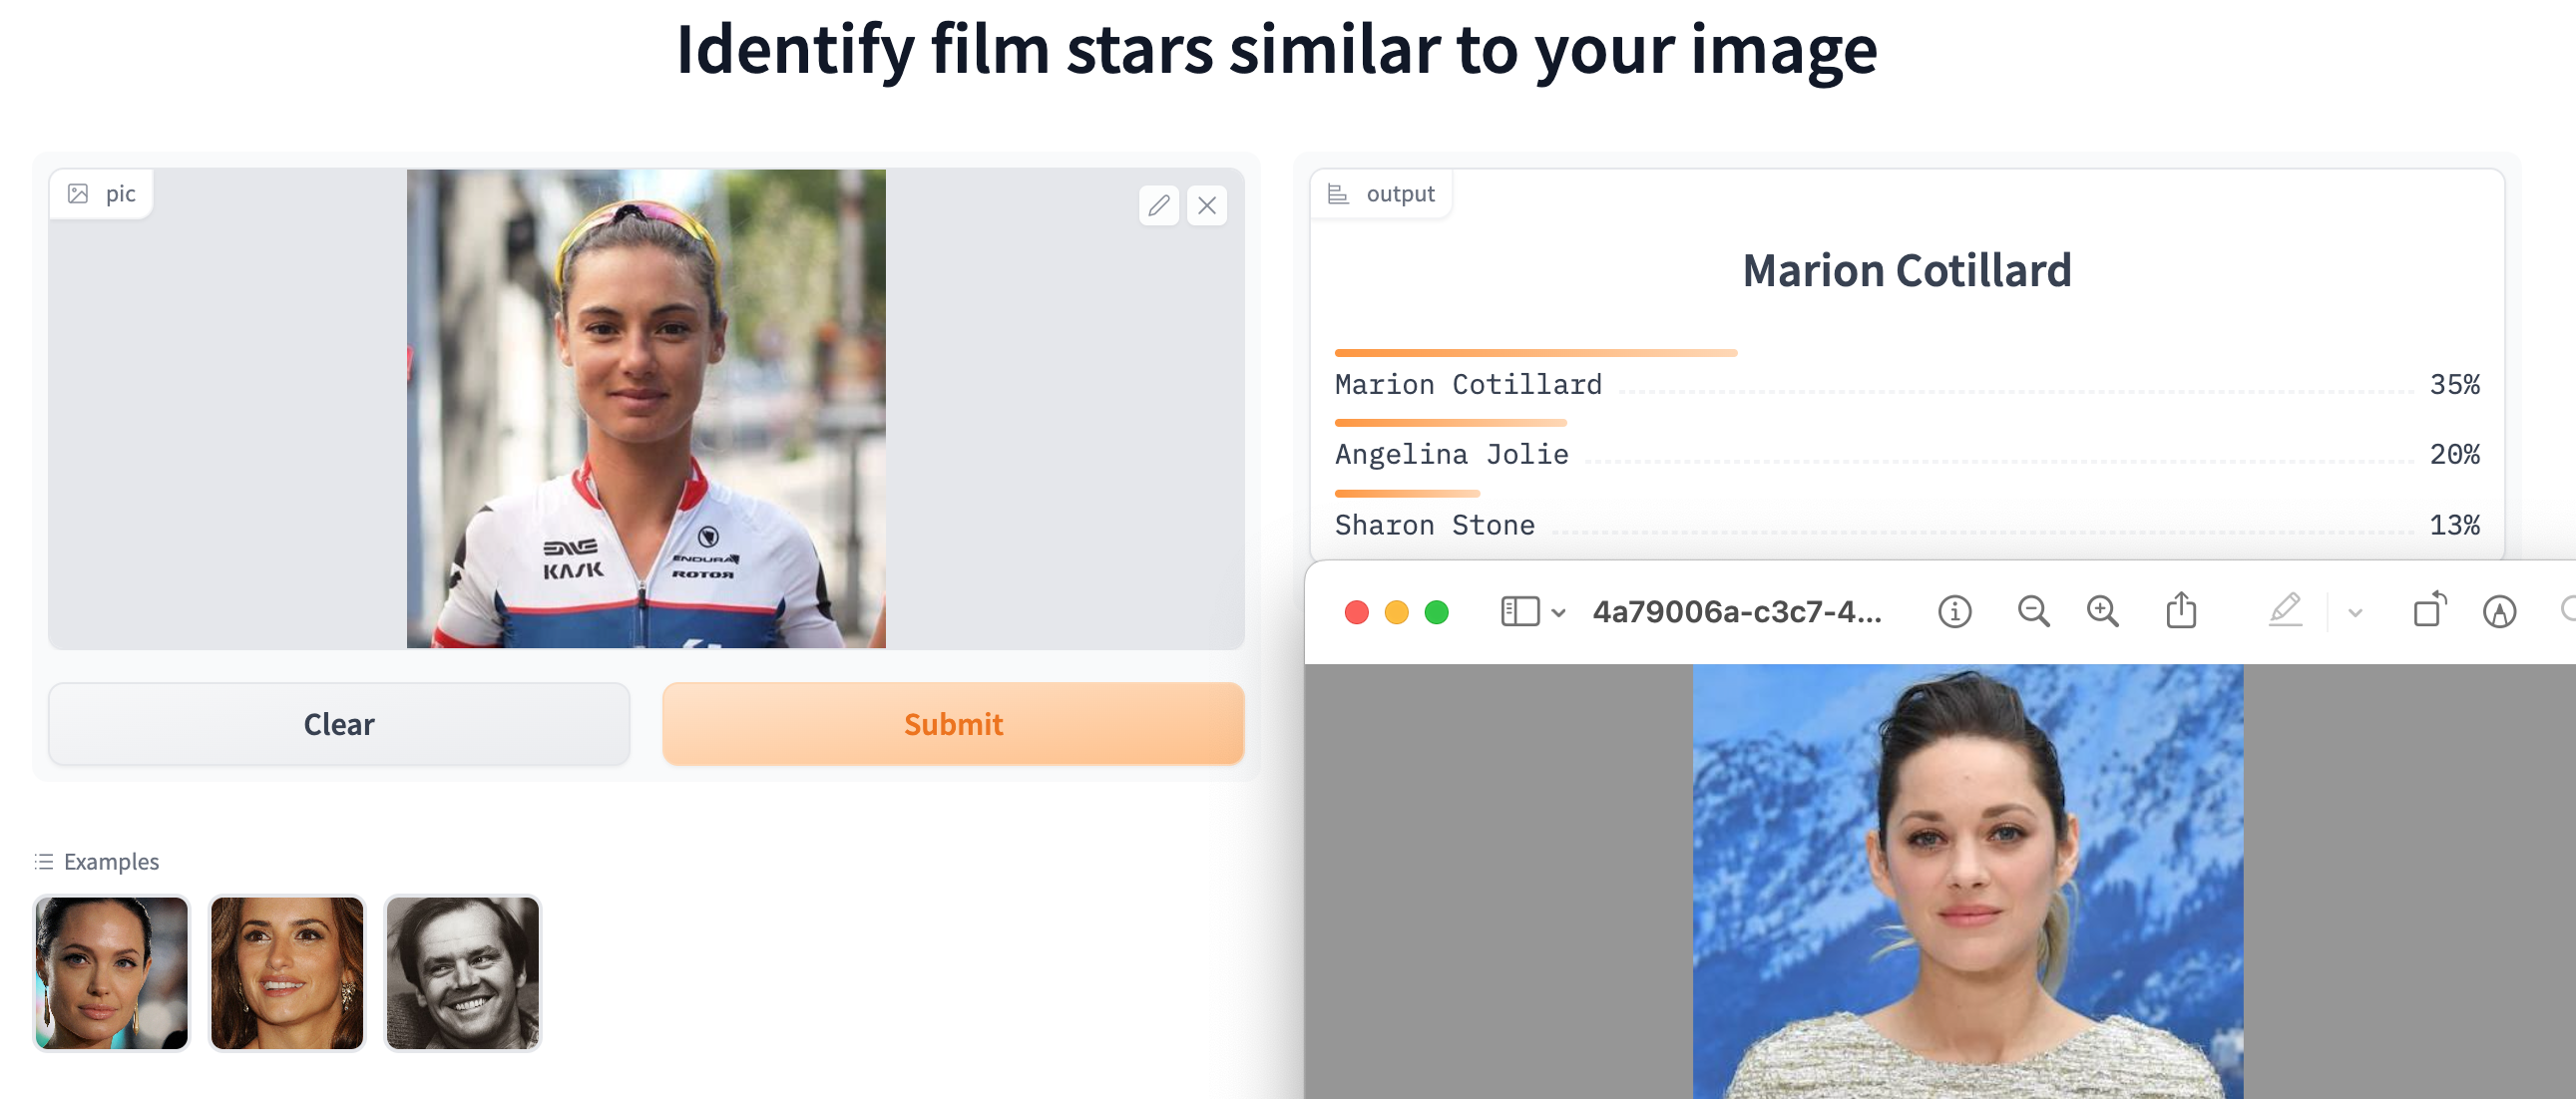
I tried it out with professional cyclists. These were the top choices.

Eddy MerckxJames Dean
Tadej PogačarMatt Damon
Remco EvenepoelMel Gibson
Mathieu van der PoelLeonardo DiCaprio
Wout van Aert Brad Pitt
Marianne VosJodie Foster
Ashleigh MoolmanMarion Cotillard
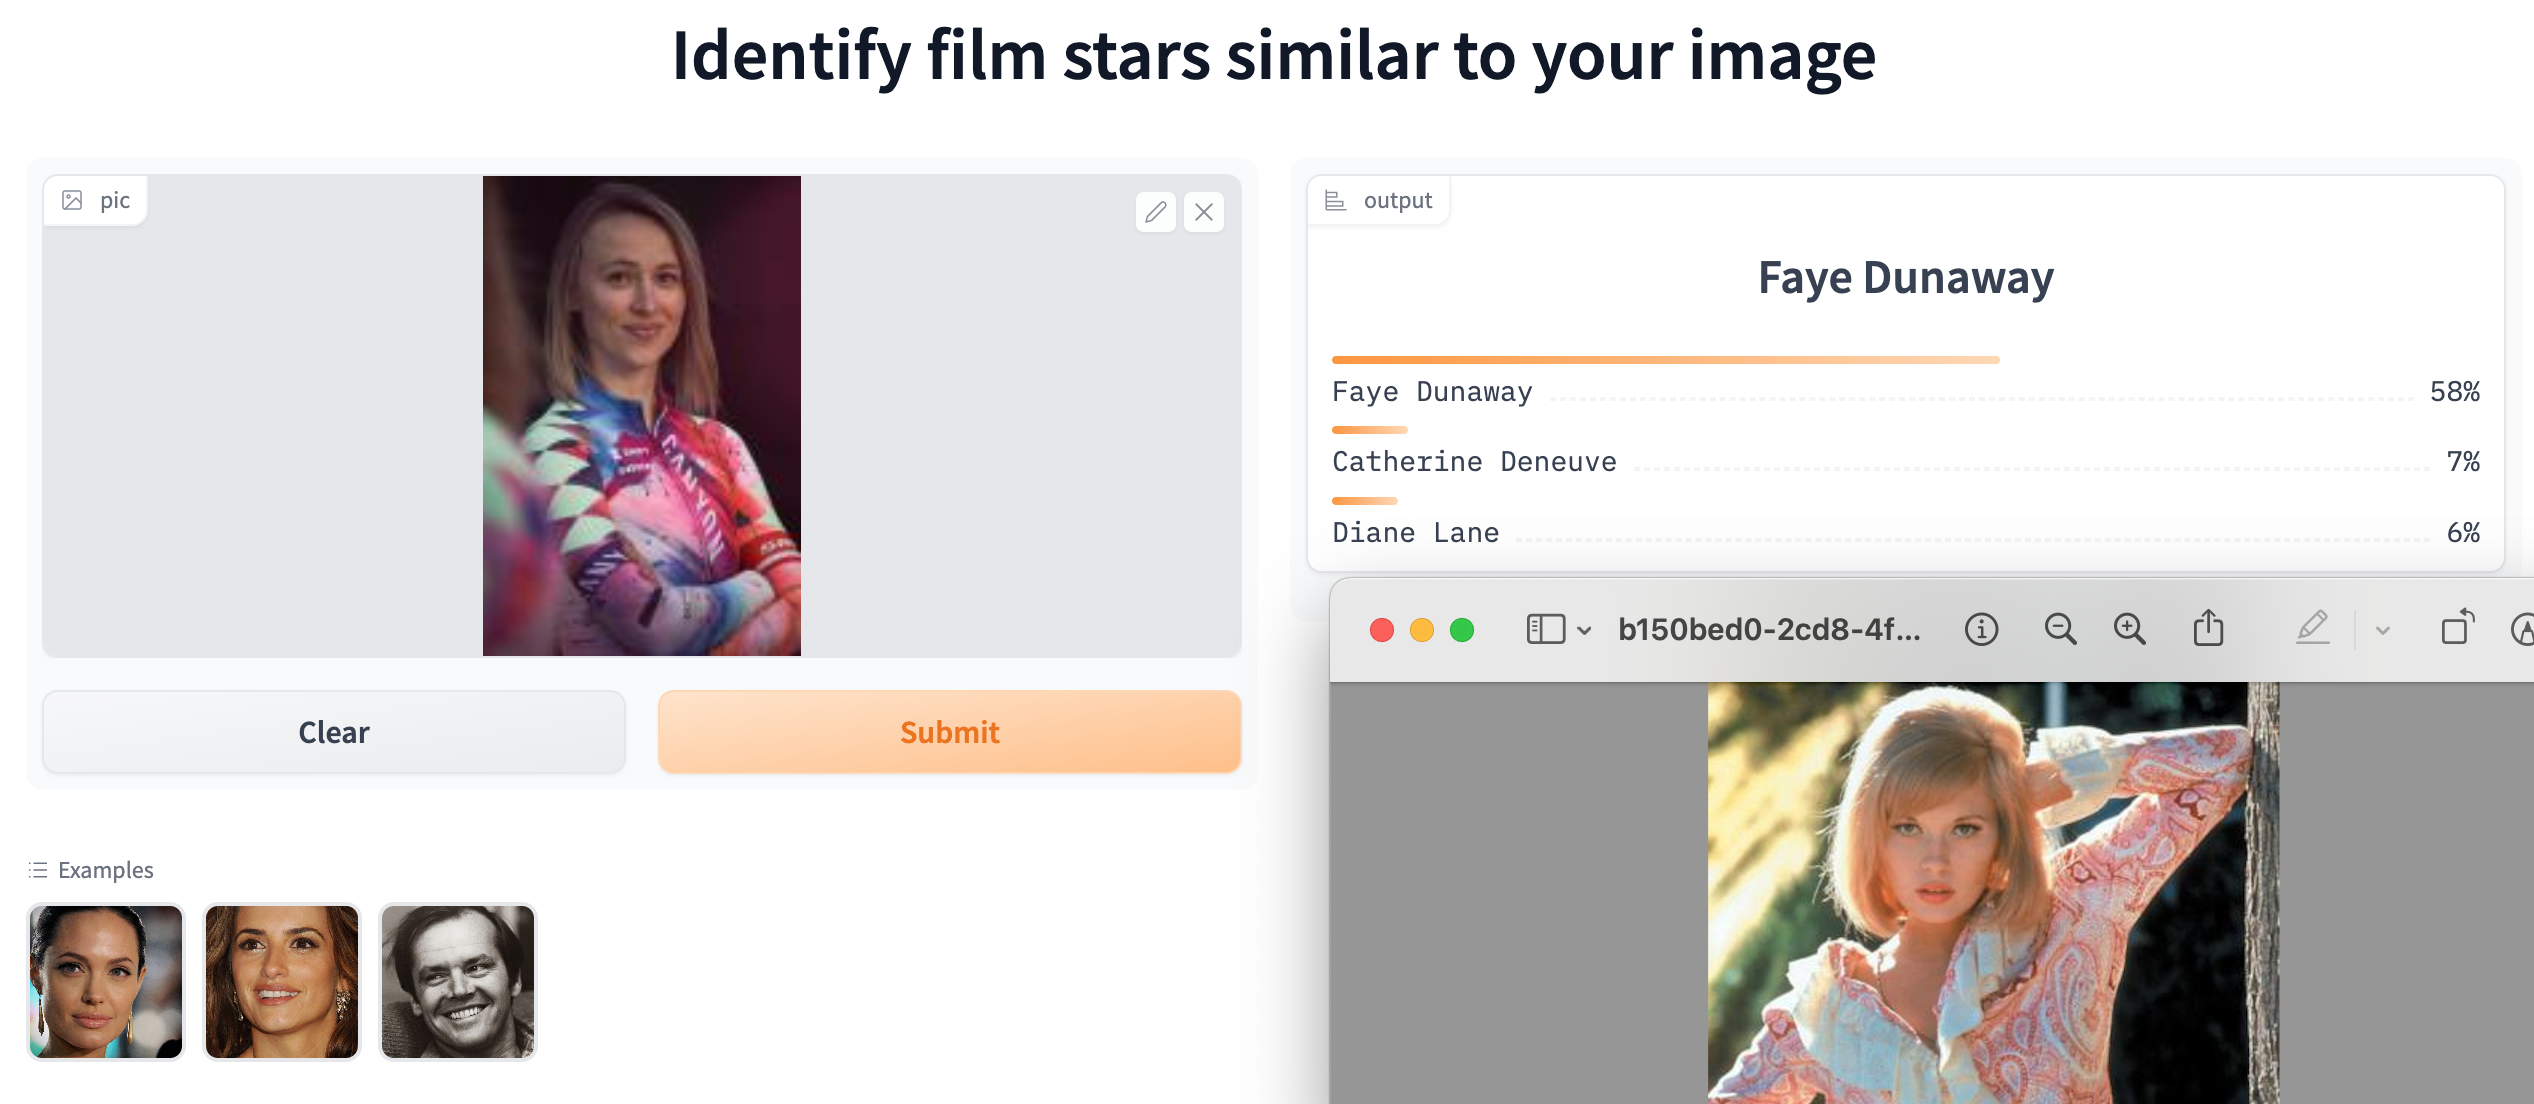
Katarzyna NiewiadomaFaye Dunaway
Anna van der BreggenBrigitte Bardot
Cycling Stars

In each case I found an image of the top choice of film star for comparison.

The model was more confident with the male cyclists, though it really depends on the photo and even the degree of cropping applied to the image. The nice thing about the app is that people like to be compared to attractive film stars, though there are are few shockers in the underlying database. The model does not deal very well with beards and men with long hair. It is best to use a “movie star” type of image, rather than someone wearing cycling kit.

Closing the gap

Artwork: David Mitchell

One of the big differences between amateur and professional cycle racing is the role of the breakaway. Amateur racing usually consists of a succession of attacks until a group of strong riders breaks away and disappears into the distance to contest the win. There is rarely enough firepower left in the peloton to close down the gap.

This contrasts with professional racing, where a group of weaker riders typically contests for the breakaway, hoping that the pursuing teams will miscalculate their efforts to bring their leaders to the head of the race in the final kilometres. Occasionally a solo rider launches a last minute attack, forcing other riders to chase.

One minute for every ten kilometres

Much of the excitement for cycling fans is generated by the tension between the breakaway and the peloton, especially when the result of the race hangs in the balance until the final metres. Commentators often say that the break needs a lead of at least one minute for every ten kilometres before the finish line. Where does this rule of thumb come from?

It’s time for some back of the envelope calculations. On flat terrain, the breakaway may ride the final 10km of a professional race at about 50kph. A lead of one minute equates to a gap of 833m, which the peloton must close within the 12 minutes that it will take the breakaway riders to reach the finish line. This means the peloton must ride at 54.2kph, which is just over 8.3% faster than the riders ahead.

On a flat road power would be almost exclusively devoted to overcoming aerodynamic drag. The effort rises with the cube of velocity, so the power output of the chasing riders needs to be 27% high. If the breakaway riders are pushing out 400W, the riders leading the chasing group need to be doing over 500W.

The peloton has several advantages. Riding in the bunch saves a lot of energy, especially relative to the efforts of a small number of riders who have been in a breakaway all day. This means that many riders have energy reserves available to lift the pace at the end of the race. Teams are drilled to deploy these reserves efficiently by drafting behind the riders who are emptying themselves at the front of the chasing pack. Having the breakaway in sight provides a psychological boost as the gap narrows. The one minute rule suggests these benefits equate to a power advantage of around 25%.

Not for an uphill finish

If the race finishes on a long climb, a one minute lead is very unlikely to be enough for the break to stay away. Ascending at 25kph equates to a gap of only 417m and now the peloton has 25 minutes to make up the difference. This can be achieved by riding at 26kph. This is just 4% faster, requiring 13% higher power to overcome the additional aerodynamic drag. This would be about 450W, if the break is holding 400W.

The chasing peloton still has fresher riders, who may be able to see the break up the road, they do not have the same drafting advantages when climbing at 26kph. The other big factor is gravity. The specialist climbers are able to put in strong accelerations on steep sections, quickly gaining on those ahead. They can climb faster than heavier riders at equivalent power.

If we take the same figure for the power advantage over the break as before, of around 25%, the break would need to have a lead of 1 minute 55 seconds as it passes the 10km banner. However, experience suggests that unless there is a very strong climber in the break, a much bigger time gap would be required for the break to stay away.

Chasing downhill

This analysis also explains why it is very difficult to narrow a gap on a fast descent. Consider a 10km sweeping road coming down from an alpine pass to the valley. Riding at 60kph, a one minute gap equates to 1km. The peloton would have to average 66kph over the whole 10km in order to make the catch in then ten minute descent. In spite of the assistance of gravity, the 10% higher speed converts into a 33% increase in the effect of drag, where riders begin to approach terminal velocity.

Amateur breaks

Amateurs do not have the luxury of a directeur sportif running a spreadsheet in a following team car. In fact you are lucky if you anyone gives you an idea of a time gap. The best strategy is firstly to follow the attacks of the strongest riders in order to get into a successful break and then encourage your fellow breakaway riders, verbally and by example, to ride through and off, in order to establish a gap. As you get closer to the finish, you should assess the other riders in order to work out how you are going to beat them over the line.

Critical Power Model – energy and waste

The critical power model is one of the most useful tools for optimising race performance, but why does it work? The answer lies in the connection between the depletion of energy reserves and the accumulation of waste products.

Variation of W’ Balance over a race

A useful overview of the critical power model can be found in a paper by Clarke and Skiba. It applies well to cycling, where power can be measured directly, and to other sports were velocity can play the role of power. Critical power (CP) is the maximum power that an athlete can sustain for a long time without suffering fatigue. This measure of performance is closely related to other threshold values, including lactate threshold, gas exchange threshold, V̇O2max and functional threshold power (FTP). An advantage of CP is that it is a directly related to performance and can be measured outside a laboratory.

The model is based on empirical observations of how long athletes can sustain levels of power, P, in excess of their personal CP. The time to exhaustion tends to be inversely proportional to the extent that P exceeds CP. This can be described by a simple formula, where excess power multiplied by time to exhaustion, t, is a constant, known as W’ (read as “W-prime”) or anaerobic power capacity.

(P-CP)t=W’

Physics tells us that power multiplied by time is work (or energy). So the model suggests that there is a fixed reserve of energy that is available for use when we exceed our CP. For a typical athlete, this reserve is in the order of 20 to 30 kilojoules.

Knowing your personal CP and W’ is incredibly useful

Suppose you have a CP of 250W and a W’ of 21.6kJ. You are hoping to complete a 10 mile TT in 24 minutes. This means you can afford to deplete your W’ by 0.9kJ per minute, which equates to 900J in 60 seconds or a rate of 15W. Therefore your target power should be 15W above CP, i.e. 265W. By holding that power your W’ balance would slowly fall to zero over 24 minutes.
Theoretically, you could burn through your entire W’ by sprinting at 1250W for 21.6 seconds.

Replenishing W’

While it may be possible to maintain constant power on a flat TT or on a steady climb, most race situations involve continual changes of speed. A second aspect of the critical power model is that W’ is slowly replenished as soon as your power drops below CP. The rate of replenishment varies between individuals, but it has a half-time of the order of 3.5 minutes, on gentle recovery.

This means that in a race situation, W’ can recover after an initial drop. By hiding in the peloton and drafting behind other riders, your W’ can accumulate sufficiently to mount a blistering attack, of precisely known power and duration. The chart above, generated in Golden Cheetah, shows the variation of my W’ balance during a criterium race, where I aimed to hit zero in the final sprint. You can even download an app onto your Garmin headset that measures W’ in real time. It is great for criterium racing, but becomes less accurate in longer races if you fail to take on fuel at the recommended rate.

Physiology

Although I am completely convinced that the critical power model works very well in race situations, I have always had a problem with the idea that W’ is some kind of magical energy reserve that only becomes available when my power exceeds CP. Is there a special biological label that says this glycogen is reserved only for use of when power exceeds CP?

One possible answer is that energy is produced largely by the aerobic system up to CP, but above that level, the anaerobic system has to kick in to produce additional power, hence the name anaerobic work capacity. That sounds reasonable, but the aerobic system burns a mix of two fuels, fat and glucose, while the anaerobic system burns only glucose. The glucose is derived from carbohydrates, stored in the liver and muscles in the form of glycogen. But it is all the same glucose, whether it is used aerobically or anaerobically. The critical power model seems to imply that there is a special reserve of glucose that is held back for anaerobic use. How can this be?

The really significant difference between the two energy systems is that the byproducts of aerobic metabolism are water and exhaled CO2, whereas anaerobic glycolysis produces lactic acid, which dissociates into H+ ions and lactate. Note that two H+ ions are produced from every glucose molecule. The lactate can be used as a fuel, but the accumulation of H+ ions presents a problem, by reducing the pH in the cells and making the blood more acidic. It is the H+ ions rather than the lactate that causes the burning sensation in the muscles.

The body is well equipped to deal with a drop in pH in the blood, in order to prevent the acidity from causing essential proteins to denature. Homeostasis is maintained by buffering agents, such as zwitterions, that mop up the H+ ions. However, if you keep producing more H+ ions by furiously burning glucose anaerobically, the cell environment become increasing hostile, with decreasing levels of intramuscular phosphocreatine and rising inorganic phosphate. The muscles eventually shut down because they simply can’t absorb the oxygen required to maintain the flux of ATP. There is also a theory that a “central governor” in the brain forces you to stop before too much damage ensues.

You don’t “run out of energy”; your muscles drown in their own waste products

It is acknowledged that the magnitude of the W′ might also be attributed to the accumulation of fatigue-related metabolites, such as H+ and Pi and extracellular K+.

Jones et al

If you reach the point of exhaustion due to an accumulation of deleterious waste products in the muscles, why do we talk about running out of energy? And what does this have to do with W’?

Firstly note that CP represents the maximum rate of aerobic exertion, at which the body is able to maintain steady state. Oxygen, inhaled by the lungs, is transported to the muscles and the CO2 byproduct is exhaled. Note that the CO2 causes some acidity in the blood, but this is comfortably managed by the buffering agents.

The connection between H+ ions and energy is evident in the following simple chemical formula for anaerobic glycolysis. Each glucose molecule produces two lactate ions and two H+ ions, plus energy.

C6H12O6 → 2 CH3COCO2 + 2 H+ + Energy

This means that the number of H+ ions is directly proportional to energy. A W’ of 21.6kJ equates to a precise number of excess H+ ions being produced aerobically. If you maintain power above CP, the H+ ions accumulate, until the muscles stop working.

If you reduce power below CP, you do not accumulate a magic store of additional energy stores. What really happens is that your buffering systems slowly reduce the accumulated H+ ions and other waste products. This means you are able to accommodate addition H+ ions next time you exceed CP and the number of H+ ions equates to the generation a specific amount of energy that can be conveniently labeled W’.

Conclusion

W’ or anaerobic work capacity acts as a convenient, physically meaningful and measurable proxy for the total accumulated H+ ions and other waste products that your muscles can accommodate before exhaustion is reached. When racing, as in life, is always a good idea to save energy and reduce waste.

References

Overview : Rationale and resources for teaching the mathematical modeling of athletic training and performance, David C. Clarke and Philip F. Skiba

Detailed analysis: Critical Power: Implications for Determination of V˙O2max and Exercise Tolerance, Andrew Jones et al

Implementation: W’bal its implementation and optimisation, Mark Liversedge

Wasteland – my message to COP26

Click on image to play

Wasteland

The sun went down
On a barren old town
Just a grave of degradation.
Once was green
Now a desolate scene
Not a blade of vegetation.
Cutting down trees anywhere you please
Is it really human nature?

The heat is on
As the desert moves on
In world of mass migration.
Floods and storms
Setting up new norms,
Butterfly wing causation.
Hurricanes blow and the night skies glow
In a primal scream of nature.

You never walked in the wasteland
You never came face to face, man.
But I knew.
We all knew…
…You knew too.

Electric cars
Never getting too far
In a green revolution.
SpaceX guy
Putting rockets in the sky
Spilling out more pollution.
Will getting on a plane, ever feel the same
When you stop and think about the future?

What a good day
For the prophets to say
The levels of the seas are rising.
Does anyone care
When they’re blowing hot air?
Is anyone compromising?
When it’s hotter each day our children pay
With a volatile mixed-up future.

You never walked in the wasteland
You never came face to face, man.
But I knew.
We all knew…
…You knew too.

Supercompensating with Strava

Supercompensation sounds like a reference to an investment banker’s salary, but in fact it describes the body’s ability to adapt positively to a training stimulus. The idea is to attain a higher level of fitness, following a training session, than you had before. In fact, that is generally the point of training. This concept is closely linked to Strava’s Fitness and Freshness charts.

The development of athletic performance requires a delicate balance between an adequate stimulus that drives adaptation and the provision of sufficient recovery time to allow these adaptations to take place

Endocrinology of Physical Activity in Sport, Third Edition

Much has been written about supercompensation, but, as the quotation above highlights, improving your own personal performance depends on
– applying the optimal amount of training stimulus and
– allowing the correct amount of recovery time.

How does supercompensation work?

A hard training session puts your body under stress. An athlete who is perspiring profusely and complaining of aching limbs experiences similar symptoms to a patient with a severe fever. The stress induced by both of these situations is picked up in the brain by the hypothalamus, which triggers a range of hormonal responses, putting the body into recovery mode.

Physical exercise challenges the muscular-skeletal, cardiovascular and neurological systems. The hormonal response elicits a range of actions around the body, including muscle repair, replenishment of glycogen stores, increase in mitochondria and reinforcement of neural pathways. These processes do not begin until activity has ceased, so, in fact, you become fitter during the rest and recovering phase, rather than while you are actually exercising.

The recovery processes take time and energy. In addition to fuelling before and during exercise, it is important to refuel after a hard training session, particularly during the first 20 minutes.

Optimal training stimulus

Training stimulus is a function of duration and intensity. Strava measures this as Training Load, which shows up as Training Impulse on your Fitness & Freshness chart. This is similar to other commonly used measures. You should also have in mind what aspect of fitness you need to develop for your target events (endurance, power, sprint etc.).

I recently rode over 200km from London to Brighton and back, which Strava calculated as a Training Load of 400. Unfortunately this probably did not make me much fitter, because it left me greatly fatigued. During the next two days that I spent recovering, my body probably just about reattained its previous base line level of fitness and failed to achieve supercompensation. It was a great ride, but it was also an example of excessive training stimulus .

On the other hand, going for a gentle ride without any strong effort is unlikely to put the body under enough stress to give rise to the desired hormonal response. Any supercompensation is likely to be minimal. Some people might call this “junk training”, because higher duration or intensity is needed, in order to become fitter.

So what is the optimal training stimulus should you aim for? A simple answer is to check your Strava Fitness & Freshness page and set a target Training Load equal to about 1.3 to 1.5 times your current Fitness (quite a hard session). This all links back to how to ramp up your fitness.

The right recovery time

As mentioned above, you get fitter while you are recovering. Ideally your next training session should be timed to match the peak of supercompensation. The colour coding of the chart provides a traffic light system. If you train again too early, your body will not have time to recover. But if you leave it too long, you miss the opportunity. As a general rule, it is sensible to follow a hard training day with an easier day. It is also very important to take one full rest day per week, where activity is limited to nothing more than a short walk or some stretching. When is comes to recovery, remember that sleep is “Chief nourisher in life’s feast”.

Functional overreaching (FOR)

Good periodisation of training stimulus and recovery results in beneficial performance adaptation, known as functional overreaching. This stimulates anabolic (muscle building) hormones, such as IGF1 and testosterone, while stress hormones, like cortisol remain low. The athlete sees a steady improvement in performance.

Nonfunctional overreaching (NFOR)

Nonfunctional overreaching occurs when an athlete is too eager to train again. Without sufficient recovery, the body is only just back to base line when it is hit with another bout of exercise. No time is allowed for the anabolic response. This is throwing away the potential benefits of supercompensation and leads to a stagnation of performance.

Overtraining syndrome (OTS)

Overtraining syndrome occurs when the next training session begins before the body has fully recovered from the last one. This can be a problem for athletes juggling a high number of training hours with a full-time job. When the endocrine system is put under this level of stress, cortisol, prolactin and creatine kinase tend to rise, while sex steroids become depressed. This results in an accumulation of fatigue and a progressive deterioration of performance.

When were you last in a fully recovered state?

You can tell which of these situations applies to you, by asking how long has it been since you were in a fully recovered state? If it is days, you should be able to get fitter. If it is weeks, you may be in a state of nonfunctional overreaching. If you have not been in a fully recovered state for months, you have overtraining syndrome. The period taken to recover to a healthy state often has the same timescale.

How do I know if I am in a fully recovered state?

Various apps use heart rate variability (HRV) as an indicator of recovery. Alternatively, you can activate the sliders for Fatigue and Form on your Strava Fitness & Freshness page and look for positive Form. This is when Fitness is greater than Fatigue. My chart below shows a sustained period of high Fatigue and negative Form in April, suggesting that some of the training in that heavy block may have been somewhat counterproductive, but at least I took a rest week in early May.

Super compensation

Supercompensation is the underlying mechanism of periodised training. It works on a number of timescales from the days in a weekly plan, to the weeks in a monthly plan and up to the months in the season’s plan. I hope that this read has provided you with super compensation.

Related posts