Supercompensating with Strava

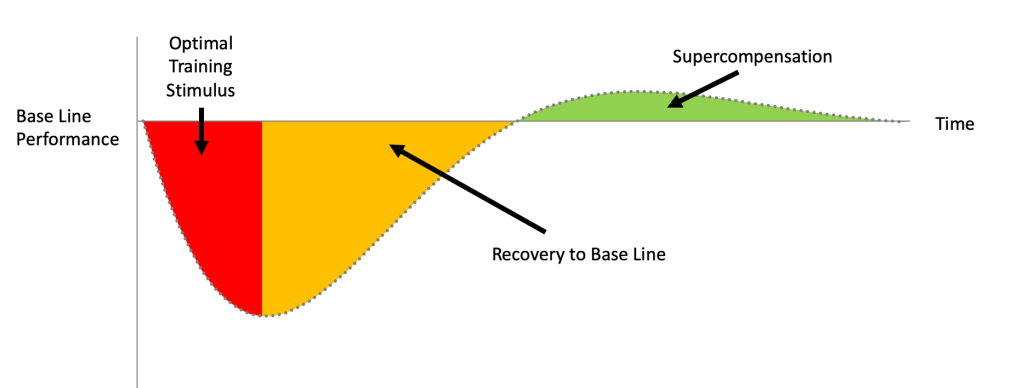
Supercompensation sounds like a reference to an investment banker’s salary, but in fact it describes the body’s ability to adapt positively to a training stimulus. The idea is to attain a higher level of fitness, following a training session, than you had before. In fact, that is generally the point of training. This concept is closely linked to Strava’s Fitness and Freshness charts.

The development of athletic performance requires a delicate balance between an adequate stimulus that drives adaptation and the provision of sufficient recovery time to allow these adaptations to take place

Endocrinology of Physical Activity in Sport, Third Edition

Much has been written about supercompensation, but, as the quotation above highlights, improving your own personal performance depends on
– applying the optimal amount of training stimulus and
– allowing the correct amount of recovery time.

How does supercompensation work?

A hard training session puts your body under stress. An athlete who is perspiring profusely and complaining of aching limbs experiences similar symptoms to a patient with a severe fever. The stress induced by both of these situations is picked up in the brain by the hypothalamus, which triggers a range of hormonal responses, putting the body into recovery mode.

Physical exercise challenges the muscular-skeletal, cardiovascular and neurological systems. The hormonal response elicits a range of actions around the body, including muscle repair, replenishment of glycogen stores, increase in mitochondria and reinforcement of neural pathways. These processes do not begin until activity has ceased, so, in fact, you become fitter during the rest and recovering phase, rather than while you are actually exercising.

The recovery processes take time and energy. In addition to fuelling before and during exercise, it is important to refuel after a hard training session, particularly during the first 20 minutes.

Optimal training stimulus

Training stimulus is a function of duration and intensity. Strava measures this as Training Load, which shows up as Training Impulse on your Fitness & Freshness chart. This is similar to other commonly used measures. You should also have in mind what aspect of fitness you need to develop for your target events (endurance, power, sprint etc.).

I recently rode over 200km from London to Brighton and back, which Strava calculated as a Training Load of 400. Unfortunately this probably did not make me much fitter, because it left me greatly fatigued. During the next two days that I spent recovering, my body probably just about reattained its previous base line level of fitness and failed to achieve supercompensation. It was a great ride, but it was also an example of excessive training stimulus .

On the other hand, going for a gentle ride without any strong effort is unlikely to put the body under enough stress to give rise to the desired hormonal response. Any supercompensation is likely to be minimal. Some people might call this “junk training”, because higher duration or intensity is needed, in order to become fitter.

So what is the optimal training stimulus you should aim for? A simple answer is to check your Strava Fitness & Freshness page and set a target Training Load equal to about 1.3 to 1.5 times your current Fitness (quite a hard session). This all links back to how to ramp up your fitness.

The right recovery time

As mentioned above, you get fitter while you are recovering. Ideally your next training session should be timed to match the peak of supercompensation. The colour coding of the chart provides a traffic light system. If you train again too early, your body will not have time to recover. But if you leave it too long, you miss the opportunity. As a general rule, it is sensible to follow a hard training day with an easier day. It is also very important to take one full rest day per week, where activity is limited to nothing more than a short walk or some stretching. When is comes to recovery, remember that sleep is “Chief nourisher in life’s feast”.

Functional overreaching (FOR)

Good periodisation of training stimulus and recovery results in beneficial performance adaptation, known as functional overreaching. This stimulates anabolic (muscle building) hormones, such as IGF1 and testosterone, while stress hormones, like cortisol remain low. The athlete sees a steady improvement in performance.

Nonfunctional overreaching (NFOR)

Nonfunctional overreaching occurs when an athlete is too eager to train again. Without sufficient recovery, the body is only just back to base line when it is hit with another bout of exercise. No time is allowed for the anabolic response. This is throwing away the potential benefits of supercompensation and leads to a stagnation of performance.

Overtraining syndrome (OTS)

Overtraining syndrome occurs when the next training session begins before the body has fully recovered from the last one. This can be a problem for athletes juggling a high number of training hours with a full-time job. When the endocrine system is put under this level of stress, cortisol, prolactin and creatine kinase tend to rise, while sex steroids become depressed. This results in an accumulation of fatigue and a progressive deterioration of performance.

When were you last in a fully recovered state?

You can tell which of these situations applies to you, by asking how long has it been since you were in a fully recovered state? If it is days, you should be able to get fitter. If it is weeks, you may be in a state of nonfunctional overreaching. If you have not been in a fully recovered state for months, you have overtraining syndrome. The period taken to recover to a healthy state often has the same timescale.

How do I know if I am in a fully recovered state?

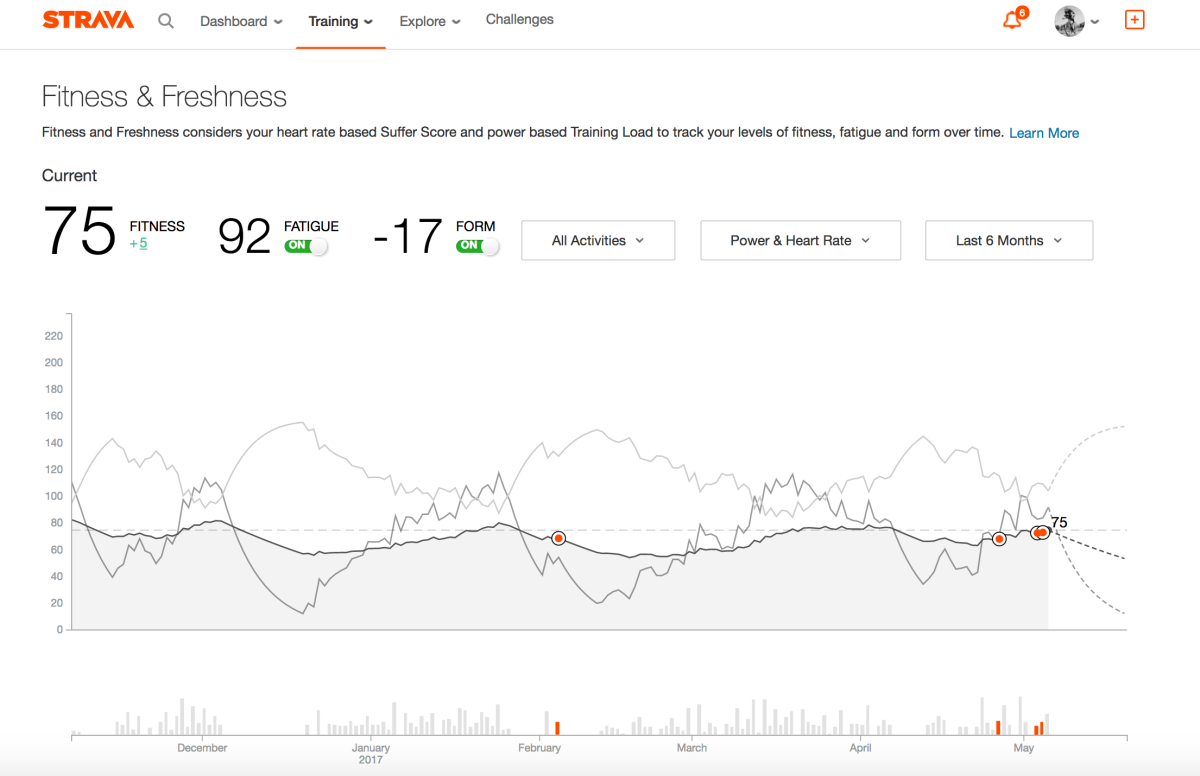
Various apps use heart rate variability (HRV) as an indicator of recovery. Alternatively, you can activate the sliders for Fatigue and Form on your Strava Fitness & Freshness page and look for positive Form. This is when Fitness is greater than Fatigue. My chart below shows a sustained period of high Fatigue and negative Form in April, suggesting that some of the training in that heavy block may have been somewhat counterproductive, but at least I took a rest week in early May.

Super compensation

Supercompensation is the underlying mechanism of periodised training. It works on a number of timescales from the days in a weekly plan, to the weeks in a monthly plan and up to the months in the season’s plan. I hope that this read has provided you with super compensation.

Related posts

Modelling Strava Fitness and Freshness

Since my blog about Strava Fitness and Freshness has been very popular, I thought it would be interesting to demonstrate a simple model that can help you use these metrics to improve your cycling performance.

As a quick reminder, Strava’s Fitness measure is an exponentially weighted average of your daily Training Load, over the last six weeks or so. Assuming you are using a power meter, it is important to use a correctly calibrated estimate of your Functional Threshold Power (FTP) to obtain an accurate value for the Training Load of each ride. This ensures that a maximal-effort one hour ride gives a value of 100. The exponential weighting means that the benefit of a training ride decays over time, so a hard ride last week has less impact on today’s Fitness than a hard ride yesterday. In fact, if you do nothing, Fitness decays at a rate of about 2.5% per day.

Although Fitness is a time-weighted average, a simple rule of thumb is that your Fitness Score equates to your average daily Training Load over the last month or so. For example, a Fitness level of 50 is consistent with an average daily Training Load (including rest days) of 50. It may be easier to think of this in terms of a total Training Load of 350 per week, which might include a longer ride of 150, a medium ride of 100 and a couple of shorter rides with a Training Load of 50.

How to get fitter

The way to get fitter is to increase your Training Load. This can be achieved by riding at a higher intensity, increasing the duration of rides or including extra rides. But this needs to be done in a structured way in order be effective. Periodisation is an approach that has been tried and tested over the years. A four-week cycle would typically include three weekly blocks of higher training load, followed by an easier week of recovery. Strava’s Fitness score provides a measure of your progress.

Modelling Fitness and Fatigue

An exponentially weighted moving average is very easy to model, because it evolves like a Markov Process, having the following property, relating to yesterday’s value and today’s Training Load.
F_{t} = \lambda * F_{t-1}+\left ( 1-\lambda  \right )*TrainingLoad_{t}
where
F_{t} is Fitness or Fatigue on day t and
\lambda = exp(-1/42) \approx 0.976 for Fitness or
\lambda = exp(-1/7) \approx 0.867 for Fatigue

This is why your Fitness falls by about 2.4% and your Fatigue eases by about 13.3% after a rest day. The formula makes it straightforward to predict the impact of a training plan stretching out into the future. It is also possible to determine what Training Load is required to achieve a target level of Fitness improvement of a specific time period.

Ramping up your Fitness

The change in Fitness over the next seven days is called a weekly “ramp”. Aiming for a weekly ramp of 5 would be very ambitious. It turns out that you would need to increase your daily Training Load by 33. That is a substantial extra Training Load of 231 over the next week, particularly because Training Load automatically takes account of a rider’s FTP.

Interestingly, this increase in Training Load is the same, regardless of your starting Fitness. However, stepping up an average Training Load from 30 to 63 per day would require a doubling of work done over the next week, whereas for someone starting at 60, moving up to 93 per day would require a 54% increase in effort for the week.

In both cases, a cyclist would typically require two additional hard training rides, resulting in an accumulation of fatigue, which is picked up by Strava’s Fatigue score. This is a much shorter term moving average of your recent Training Load, over the last week or so. If we assume that you start with a Fatigue score equal to your Fitness score, an increase of 33 in daily Training Load would cause your Fatigue to rise by 21 over the week. If you managed to sustain this over the week, your Form (Fitness minus Fatigue) would fall from zero to -16. Here’s a summary of all the numbers mentioned so far.

Impact of a weekly ramp of 5 on two riders with initial Fitness of 30 and 60

Whilst it might be possible to do this for a week, the regime would be very hard to sustain over a three-week block, particularly because you would be going into the second week with significant accumulated fatigue. Training sessions and race performance tend to be compromised when Form drops below -20. Furthermore, if you have increased your Fitness by 5 over a week, you will need to increase Training Load by another 231 for the following week to continue the same upward trajectory, then increase again for the third week. So we conclude that a weekly ramp of 5 is not sustainable over three weeks. Something of the order of 2 or 3 may be more reasonable.

A steady increase in Fitness

Consider a rider with a Fitness level of 30, who would have a weekly Training Load of around 210 (7 times 30). This might be five weekly commutes and a longer ride on the weekend. A periodised monthly plan could include a ramp of 2, steadily increasing Training Load for three weeks followed by a recovery week of -1, as follows.

Plan of a moderate rider

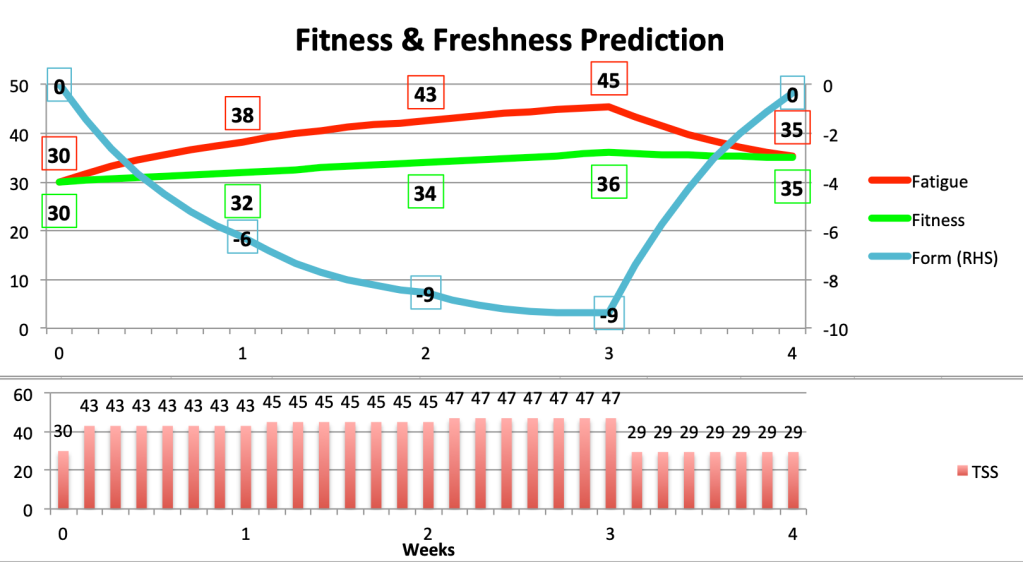
This gives a net increase in Fitness of 5 over the month. Fatigue has also risen by 5, but since the rider is fitter, Form ends the month at zero, ready to start the next block of training.

To simplify the calculations, I assumed the same Training Load every day in each week. This is unrealistic in practice, because all athletes need a rest day and training needs to mix up the duration and intensity of individual rides. The fine tuning of weekly rides is a subject for another blog.

A tougher training block

A rider engaging in a higher level of training, with a Fitness score of 60, may be able to manage weekly ramps of 3, before the recovery week. The following Training Plan would raise Fitness to 67, with sufficient recovery to bring Form back to positive at the end of the month.

A more ambitious training plan

A general plan

The interesting thing about this analysis is that the outcomes of the plans are independent of a rider’s starting Fitness. This is a consequence of the Markov property. So if we describe the ambitious plan as [3,3,3,-2], a rider will see a Fitness improvement of 7, from whatever initial value prevailed: starting at 30, Fitness would go to 37, while the rider starting at 60 would rise to 67.

Similarly, if Form begins at zero, i.e. the starting values of Fitness and Fatigue are equal, then the [3,3,3,-2] plan will always result in a in a net change of 6 in Fatigue over the four weeks.

In the same way, (assuming initial Form of zero) the moderate plan of [2,2,2,-1] would give any rider a net increase of Fitness and Fatigue of 5.

Use this spreadsheet to experiment.

Related posts

Strava Power Curve

Screen Shot 2018-05-11 at 16.34.08
Comparing Historic Power Curves

If you use a power meter on Strava premium, your Power Curve provides an extremely useful way to analyse your rides. In the past, it was necessary to perform all-out efforts, in laboratory conditions, to obtain one or two data points and then try to estimate a curve. But now your power meter records every second of every ride. If you have sustained a number of all-out efforts over different time intervals, your Power Curve can tell you a lot about what kind of rider you are and how your strengths and weaknesses are changing over time.

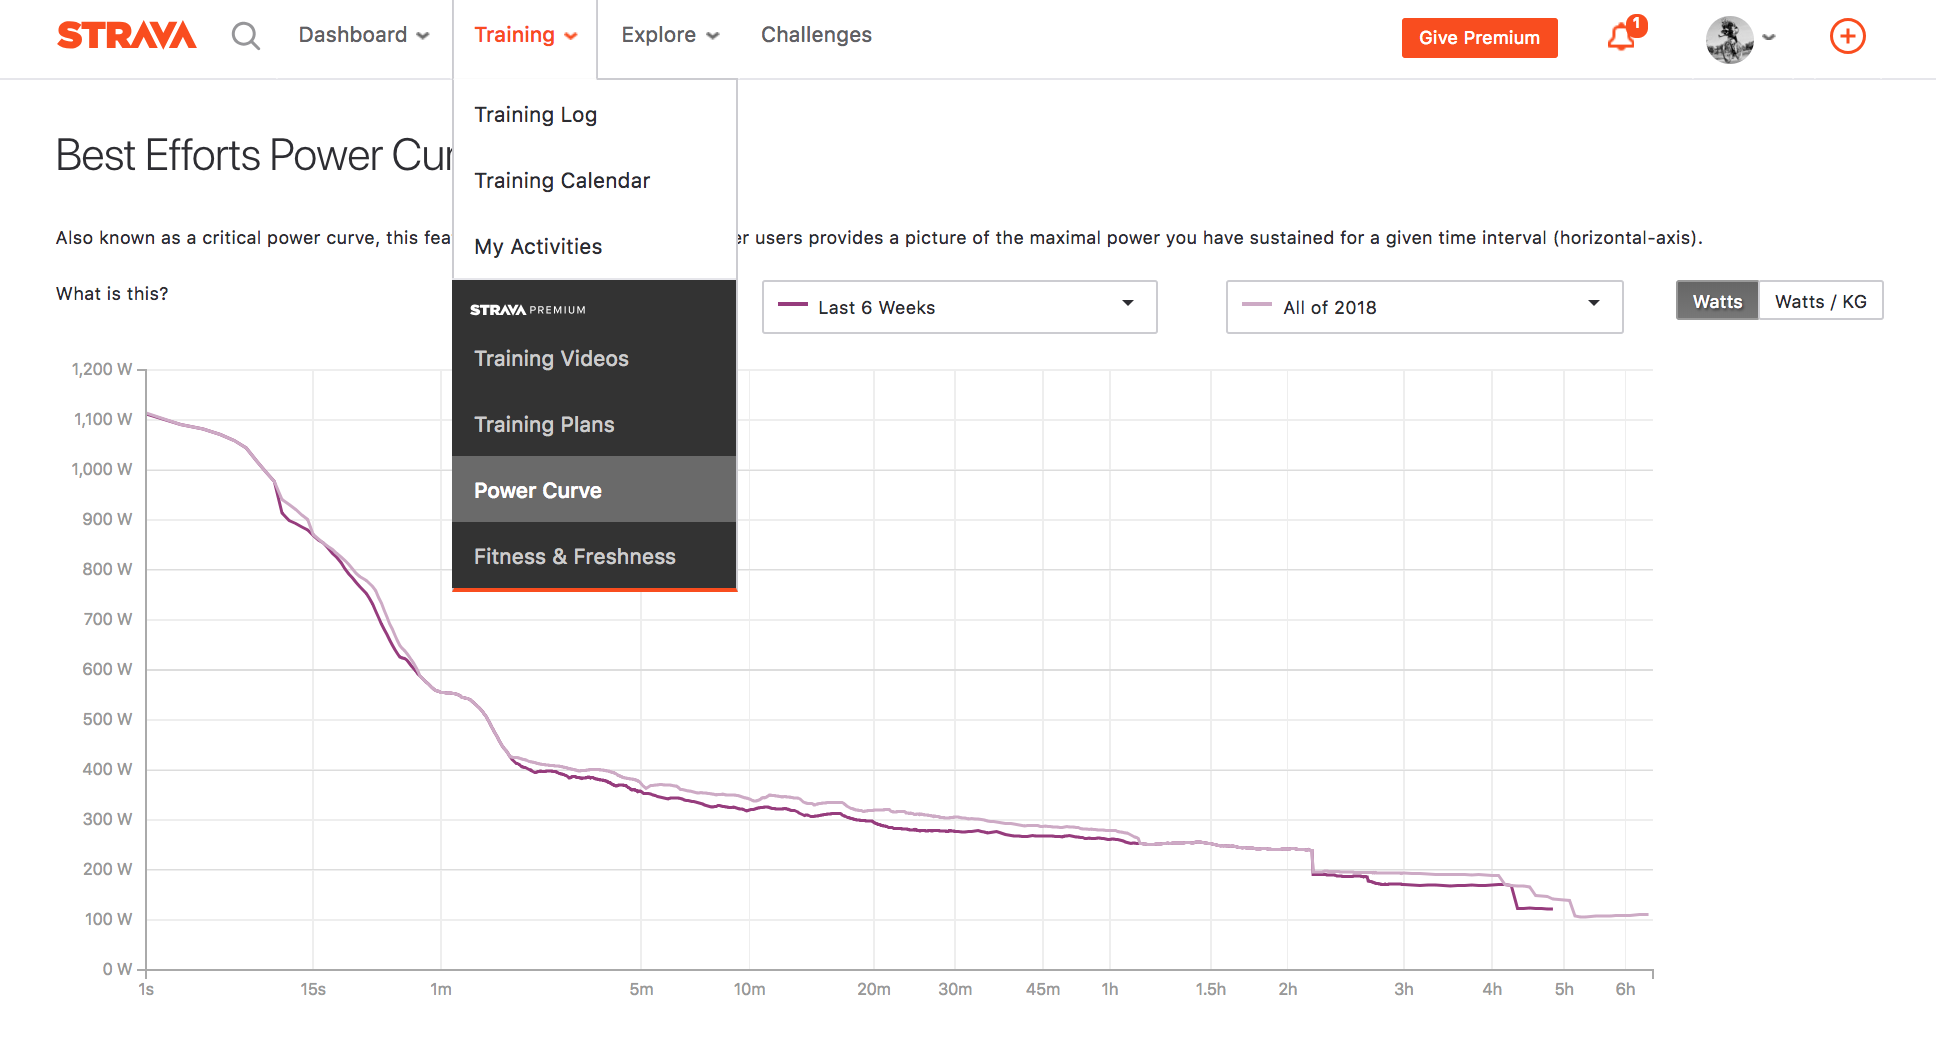
Strava provides two ways to view your Power Curve: a historical comparison or an analysis of a particular ride. Using the Training drop-down menu, as shown above, you can compare two historic periods. The curves display the maximum power sustained over time intervals from 1 second to the length of your longest ride. The times are plotted on a log scale, so that you can see more detail for the steeper part of the curve. You can select desired time periods and choose between watts or watts/kg.

The example above compares this last six weeks against the year to date. It is satisfying to see that the six week curve is at, or very close to, the year to date high, indicating that I have been hitting new power PBs (personal bests) as the racing season picks up. The deficit in the 20-30 minute range indicates where I should be focussing my training, as this would be typical of a breakaway effort. The steps on the right hand side result from having relatively few very long rides in the sample.

Note how the Power Curve levels off over longer time periods: there was a relatively small drop from my best hour effort of 262 watts to 243 watts for more than two hours. This is consistent with the concept of a Critical Power that can be sustained over a long period. You can make a rough estimate of your Functional Threshold Power by taking 95% of your best 20 minute effort or by using your best 60 minute effort, though the latter is likely to be lower, because your power would tend to vary quite a bit due to hills, wind, drafting etc., unless you did a flat time trial. Your 60 minute normalised power would be better, but Strava does not provide a weighted average/normalised power curve. An accurate current FTP is essential for a correct assessment of your Fitness and Freshness.

Switching the chart to watts/kg gives a profile of what kind of rider you are, as explained in this Training Peaks article. Sprinters can sustain very high power for short intervals, whereas time trial specialists can pump out the watts for long periods. Comparing myself against the performance table, my strengths lie in the 5 minutes to one hour range, with a lousy sprint.

Screen Shot 2018-05-11 at 17.19.45.png
Single Ride Power Curve versus Historic

The other way to view your Power Curve comes under the analysis of a particular ride. This can be helpful in understanding the character of the ride or for checking that training objectives have been met. The target for the session above was to do 12 reps on a short steep hill. The flat part of the curve out to about 50 seconds represents my best efforts. Ideally, each repetition would have been close to this. Strava has the nice feature of highlighting the part of the course where the performance was achieved, as well as the power and date of the historic best. The hump on the 6-week curve at 1:20 occurred when I raced some club mates up a slightly longer steep hill.

If you want to analyse your Power Curve in more detail, you should try Golden Cheetah. See other blogs on Strava Fitness and Freshness, Strava Ride Statistics or going for a Strava KOM.


Strava Fitness and Freshness

The last blog explored the statistics that Strava calculates for each ride. These feed through into the Fitness & Freshness chart provided for premium users. The aim is to show the accumulated effect of training through time, based on the Training-Impulse model originally proposed by Eric Banister and others in a rather technical paper published in 1976.

Strava gives a pretty good explanation of Fitness and Freshness. A similar approach is used on Training Peaks in its Performance Management Chart. On Strava, each ride is evaluated in terms of its Training Load, if you have a power meter, or a figure derived from your Suffer Score, if you just used a heart rate monitor. A training session has a positive impact on your long-term fitness, but it also has a more immediate negative effect in terms of fatigue. The positive impact decays slowly over time, so if you don’t keep up your training, you lose fitness. But your body is able to recover from fatigue more quickly.

The best time to race is when your fitness is high, but you are also sufficiently recovered from fatigue. Fitness minus fatigue provides an estimate of your form. The 1976 paper demonstrated a correlation between form and the performance of an elite swimmers’ times over 100m.

The Fitness and Freshness chart is particularly useful if you are following a periodised training schedule. This approach is recommended by many coaches, such as Joe Friel. Training follows a series of cycles, building up fitness towards the season’s goals. A typical block of training includes a three week build-up, followed by a recovery week. This is reflected in a wave-like pattern in your Fitness and Freshness chart. Fitness rises over the three weeks of training impulses, but fatigue accumulates faster, resulting in a deterioration of form. However, fatigue drops quickly, while fitness is largely maintained during the recovery week, allowing form to peak.

In order to make the most of the Fitness and Freshness charts, it is important that you use an accurate current figure for your Functional Threshold Power. The best way to do this is to go and do a power test. It is preferable to follow a formal protocol that you can repeat, such as that suggested by British Cycling. Alternatively, Strava premium users can refer to the Strava Power Curve. You can either take your best effort over 1 hour or 95% of your best effort over 20 minutes. Or you can click on the “Show estimated FTP” button  and take the lower figure. In order for this to flow through into your Fitness and Freshness chart, you need to enter your 1 hour FTP into your personal settings, under “My Performance”.

Screen Shot 2018-05-08 at 15.14.00

The example chart at the top of this blog shows how my season has panned out so far. After taking a two week break before Christmas, I started a solid block of training in January. My recovery week was actually spent skiing (pretty hard), though this did not register on Strava because I did not use a heart rate monitor. So the sharp drop in fatigue at the end of January is exaggerated. Nevertheless, my form was positive for my first race on 4 February. Unfortunately, I was knocked off and smashed a few ribs, forcing me to take an unplanned two week break. By the time I was able to start riding tentatively, rather than starting from an elevated level, my fitness had deteriorated to December’s trough.

After a solid, but still painful, block of low intensity training in March, I took another “recovery week” on the slopes of St Anton. I subsequently picked up a cold that delayed the start of the next block of training, but I have incorporated some crit races into my plan, for higher intensity sessions. If you edit the activity and make the “ride type” a “race”, it shows up as a red dot on the chart. Barring accident and illness, the hope is to stick more closely to a planned four-week cycle going forward.

This demonstrates how Strava’s tools reveal the real-life difficulties of putting the theoretical benefits of periodisation into practice.

Related posts

Modelling Strava Fitness and Freshness

Supercompensating with Strava

See other blogs on Strava Power Curve, Strava Ride Statistics or going for a Strava KOM.

Strava Ride Statistics

If you ride with a power meter and a heart rate monitor, Strava’s premium subscription will display a number of summary statistics about your ride. These differ from the numbers provided by other software, such as Training Peaks. How do all these numbers relate to each other?

A tale of two scales

Over the years, coaches and academics have developed statistics to summarise the amount of physiological stress induced by different types of endurance exercise. Two similar approaches have gained prominence. Dr Andrew Coggan has registered the names of several measures used by Training Peaks. Dr Phil Skiba has developed as set of metrics used in the literature and by PhysFarm Training Systems. These and other calculations are available on Golden Cheetah‘s excellent free software.

Although it is possible to line up metrics that roughly correspond to each other, the calculations are different and the proponents of each scale emphasise particular nuances that distinguish them. This makes it hard to match up the figures.

Here is an example for a recent hill session. The power trace is highly variable, because the ride involved 12 short sharp climbs.

Metric Coggan TrainingPeaks Skiba Literature Strava
Power equivalent physiological cost of ride Normalised Power 282 xPower 252 Weighted Avg Power 252
Power variability of ride Variability Index 1.57 Variability Index 1.41
Rider’s sustainable power Functional Threshold Power 312 Critical Power 300 FTP 300
Power cost / sustainable power Intensity Factor 0.9 Relative Intensity 0.84 Intensity 0.84
Assessment of intensity and duration of ride Training Stress Score 117 BikeScore 101 Training Load 100
Training Impulse based on heart rate Suffer Score 56

Weighted Average Power

According to Strava, Weighted Average Power takes account of the variability of your power reading during a ride. “It is our best guess at your average power if you rode at the exact same wattage the entire ride.” That sounds an awful lot like Normalized Power, which is described on Training Peaks as “an estimate of the power that you could have maintained for the same physiological “cost” if your power output had been perfectly constant (e.g., as on a stationary cycle ergometer), rather than variable”. But it is apparent from the table above that Strava is calculating Skiba’s xPower.

The calculations of Normalized Power and xPower both smooth the raw power data, raise these observations to the fourth power, take the average over the whole ride and obtain the fourth root to give the answer.

Normalized Power or xPower = (Average(Psmoothed4))1/4

The only difference between the calculations is the way that smoothing accounts for the body’s physiological delay in reacting to rapid changes in pedalling power. Normalized Power uses a 30 second moving average, whereas xPower uses a “25 second exponential average”. According to Skiba, exponential decay is better than Coggan’s linear decay in representing the way the body reacts to changes in effort.

The following chart zooms into part of the hill reps session, showing the raw power output (in blue), moving average smoothing for Normalised Power (in green), exponential smoothing for xPower (in red), with heart rate shown in the background (in grey). Two important observations can be made. Firstly, xPower’s exponential smoothing is more highly correlated with heart rate, so it could be argued that it does indeed correspond more closely with the underlying physiological processes. Secondly, the smoothing used for xPower is less volatile, therefore xPower will always be lower than Normalized Power (because the fourth-power scaling is dominated by the highest observations).

Power

Why do both metrics take the watts and raise them to the fourth power? Coggan states that many of the body’s responses are “curvilinear”. The following chart is a good example, showing the rapid accumulation of blood lactate concentration at high levels of effort.

Screen Shot 2017-04-20 at 15.08.31

Plotting the actual data from a recent test on a log-log scale, I obtained a coefficient of between 3.5 and 4.7, for the relation between lactate level and watts. This suggests that taking the average of smoothed watts raised to the power 4 gives an indication of the average level of lactate in circulation during the ride.

The hill reps ride included multiple bouts of high power, causing repeated accumulation of lactate and other stress related factors. Both the Normalised Power of 282W and xPower of 252W were significantly higher than the straight average power of 179W. The variability index compares each adjusted power against average power, resulting in variability indices of 1.57 and 1.41 respectively. These are very high figures, due to the hilly nature of the session. For a well-paced time trial, the variability index should be close to 1.00.

Sustainable Power

It is important for a serious cyclist to have a good idea of the power that he or she can sustain for a prolonged period. Functional Threshold Power and Critical Power measure slightly different things. The emphasis of FTP is on the maximum power sustainable for one hour, whereas CP is the power theoretically sustainable indefinitely. So CP should be lower than FTP.

Strava allows you to set your Functional Threshold Power under your personal performance settings. The problem is that if Strava’s Weighted Average Power is based on Skiba’s xPower, it would be more consistent to use Critical Power, as I did in the table above. This is important because this figure is used to calculate Intensity and Training Load. If you follow Strava’s suggestion of using FTP, subsequent calculations will underestimate your Training Load,  which, in turn, impacts your Fitness & Freshness curves.

Intensity

The idea of intensity is to measure severity of a ride, taking account of the rider’s individual capabilities.  Intensity is defined as the ratio of the power equivalent physiological cost of the ride relative to your sustainable power. For Coggan, the Intensity Factor is NP/FTP; for Skiba the Relative Intensity is xPower/CP; and for Strava the Intensity is Weighted Average Power/FTP.

Training Load

An overall assessment of a ride needs to take account of the intensity and the duration of a ride. It is helpful to standardise this for an individual rider, by comparing it against a benchmark, such as an all-out one hour effort.

Coggan proposes the Training Stress Score that takes the ratio the work done at Normalised Power, scaled by the Intensity Factor squared, relative to one hour’s work at FTP. Skiba defines the BikeScore as the ratio the work done at xPower, scaled by the Relative Intensity squared, relative to one hour’s work at CP. And finally, Strava’s Training Load takes the ratio the work done at Weighted Average Power, scaled by Intensity squared, relative to one hour’s work at FTP.

Note that for my hill reps ride, the BikeScore of 101, was considerably lower than the TSS of 117. Although my estimated CP is 12W lower than my FTP, xPower was 30W lower than NP. Using my CP as my Strava FTP, Strava’s Training Load is the same as Skiba’s Bike Score (otherwise I’d get 93).

Suffer Score

Strava’s Suffer Score was inspired by Eric Banister’s training-impulse (TRIMP) concept. It is derived from the amount of time spent in each heart rate zone, so it can be calculated for multiple sports. You can set your Strava heart rate zones in your personal settings, or just leave then on default, based on your maximum heart rate.

A non-linear relationship is assumed between effort and heart rate zone. Each minute in Zone 1, Endurance, is worth 12 seconds; Moderate Zone 2 minutes are worth 24 seconds; Zone 3 Tempo minutes are worth 45 seconds; Zone 4 Threshold minutes are worth 100 seconds; and Anaerobic Zone 5 minutes are worth 120 seconds. The Suffer Score is the weighted sum of minutes in each zone.

The next blog will comment on the Fitness & Freshness charts available on Strava Premium.