Large Language Models for Cycling

Amid the fanfare about the extraordinary AI capabilities of large language models (LLMs), the race is on to produce LLM applications that actually do something useful. Several hurdles obstruct the way forward, including confabulation, privacy and limitations of training data. This article explains how Retrieval-Augmented Generation can address some of these issues and help find out some useful information about cycling.

Confabulation

Since they are trained only to predict the next word in a sentence, LLMs have no understanding of the text they generate. They can have a tendency to intersperse facts with inaccurate or untrue statements in a manner that seems entirely plausible and convincing. You should not rely on an LLM for advice on important decisions without validating its response. Note that if you ask an LLM for its sources, the citations may be imaginary or if they exist the references may not support the assertions.

One way to reduce the risk of confabulation is to ask the LLM to base its answer selected relevant documents.

Privacy

If you use an online ChatBot, everything you type or upload is stored on the provider’s server. This can be used as further training data or for snooping on users. There is a significant risk that a lot of personal and proprietary company information has already been hoovered up in this way. Companies need ways to sandbox internally developed LLM tools that contain sensitive data and prevent leakage of confidential information.

Privacy can be addressed by running LLMs on local networks. This is possible because inference is a simple task relative to training, which requires banks of data servers. Many free open-source models are available. Running an open-source model locally also avoids paying a subscription to an online provider.

Limitations of training data

LLMs are trained on vast generic data sets. This is a very expensive task, so they are typically frozen at some point in time. If you ask an LLM about current news events, it will typically tell you that it was trained on data up to a certain date in the past and has no knowledge of the event. The models may also lack specialised data in narrow domains.

RAG provides a way to supplement the original training set with selected additional information relevant to the field of interest.

RAG

Retrieval-Augmented Generation is an approach that provides an LLM with additional information to help it answer a query. For example, when asked about current affairs, it would be very helpful to retrieve a copy of today’s newspaper. Companies may wish to develop LLM-based applications with specialist knowledge of internal documentation. RAG makes this possible.

When you interact with an LLM, your conversation is presented to the model in the form of a huge string of numbers called an embedding. LLMs are trained so that sentences with similar words and meanings have similar embeddings. The idea of RAG is to take one or more relevant supplementary documents, split them up into chunks and store the embeddings of these chunks in a vector database. When a user presents a query, the database retrieves the embeddings of chunks that most closely match the query. In this way, the query can be augmented with relevant chunks of text from the source material. Note that this avoids the need to do additional expensive training or fine-tuning of the LLM on specialist topics.

One weakness of RAG is that most LLMs have not been trained specifically on the types of prompts used in RAG, though some companies, like Cohere, are working on this.

Cycling Through the Pandemic

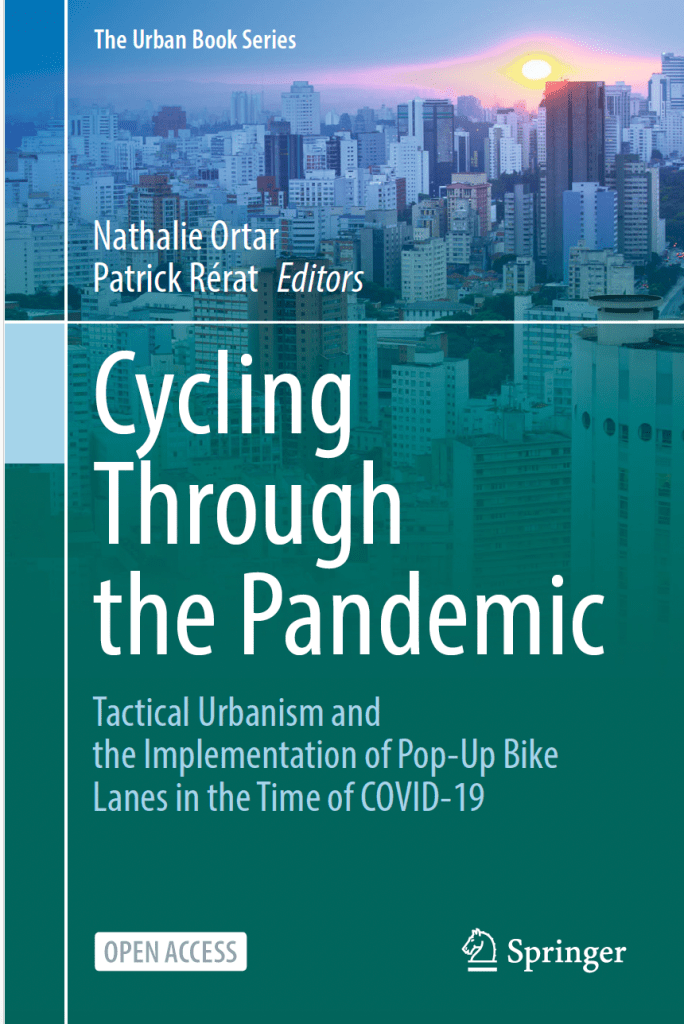
I decided to try this out using a freely available book called Cycling Through the Pandemic, which has the slightly cryptic subtitle, Tactical Urbanism and the Implementation of Pop-Up Bike Lanes in the Time of COVID-19. This 250-page book was published in 2024, so it could not have been part of the training set for the LLM that I was using.

It is unbelievably easy to download and then run an open-source LLM on your local machine. All you need to do is download LM Studio. I decided to use an open-source LLM model called Meta-Llama-3.1-8B-Instruct-GGUF. I dragged and dropped the pdf of the book into the chat-box and started asking questions.

A transcript of my conversation is recorded below. At each step, LM Studio retrieved three chunks of text from the book it considered most relevant to the query, allowing me to check the reliability of the model’s interpretation.

The model answered in good English, basing its responses on the content of the book. It corrected itself when challenged on the claim that Bogotá is in France. It even responded in French to a question posed in French. In my view, RAG can be used to produce genuinely useful applications for LLMs.

RAG dialogue based on a book about the impact of COVID 19 on cycling

You
CyclingCOVID.pdf

What is tactical urbanism

Assistant
Meta-Llama-3.1-8B-Instruct-GGUF
Intermediate steps hidden. Click to expand.

Based on the provided information, tactical urbanism refers to a type of urban planning that involves temporary and low-cost interventions aimed at introducing rapid changes to urban spaces with a broader purpose in mind (Lydon and Garcia 2015). It can be seen as a practical approach to urban change where many small actions implemented at the hyper-local level can achieve longer-term goals of creating a liveable, walkable, sustainable community.

Tactical urbanism often involves shortcuts or rapid and unbureaucratic actions taken by municipalities in response to crises (Citation 1). It can be associated with grassroots initiatives but can also be used by authorities. This approach has been implemented in various contexts, including during the COVID-19 pandemic.

Tactical urbanism is characterized by its focus on temporary and flexible material approaches to urban change, which can be both a practical tool for citizens and enterprising governments alike (Citation 3).

It’s worth noting that there are different perspectives on tactical urbanism, with some viewing it as a means of achieving substantive change without state action, while others see the increasing professionalization of these activities as borrowing their material design language (Citation 2).

You
Why was cycling boosted by COVID 19?

Assistant
Meta-Llama-3.1-8B-Instruct-GGUF
Retrieved 3 relevant citations for user query
Done predicting
Cycling saw a boost during the COVID-19 pandemic for several reasons (Citation 2). Firstly, people had less need to travel due to home working and distance learning. Secondly, the fear of infection led to a strong decline in ridership on public transport, which benefited cycling. Additionally, active mobilities such as cycling were promoted as a means of staying fit and getting exercise when other recreational facilities were closed.

The pandemic also led to an increase in cycling for leisure activities (Buehler and Pucher 2021b), with the strongest increase seen on weekends and in the afternoon. This shift towards cycling as a leisure activity is likely due to the rise of “undirected travel,” or trips without a specific destination, which was encouraged by social distancing measures.

In France, for instance, the first COVID-19 related lockdown led to a rapid increase in cycling use (Buehler and Pucher 2022) and implemented temporary cycle paths. Governments saw cycling as a solution to develop health-friendly mobility while responding to the possible desertion of public transport due to fear of catching the virus (Citation 3).

You
Has the COVID related boost in cycling persisted

Assistant
Meta-Llama-3.1-8B-Instruct-GGUF
Retrieved 3 relevant citations for user query
Done predicting
The survey conducted in Geneva and Lausanne (Rérat et al. 2022; Schmassman and Rérat 2022) found that the COVID-related boost in cycling has largely persisted. The majority of respondents reported cycling as much or more often than before the pandemic, with a significant number even starting to cycle for the first time.

In Geneva, 42% of respondents cycled as much as before, while 44% cycled more often. In Lausanne, 58% cycled as much as before, and 27% cycled more often. This suggests that many people have adopted cycling as a mode of transport during the pandemic and are likely to continue using it.

The fact that 81% of respondents in Geneva (73% in Lausanne) agree or strongly agree that COVID cycle lanes make them feel safer also suggests that these temporary infrastructure projects had a lasting impact on cyclist safety and behavior.

However, as mentioned by Citation 2, the long-term sustainability of this boost is still uncertain. The study notes that most cycling infrastructure implemented during the pandemic involved existing projects, and it remains to be seen whether this “leap forward” will make a lasting difference in the trajectory of local public action or simply represent a spike on an upward graph.

Overall, while there are indications that the COVID-related boost in cycling has largely persisted, further analysis is needed to determine its long-term impact.

You
What has been the impact specifically in London?

Assistant
Meta-Llama-3.1-8B-Instruct-GGUF
Retrieved 3 relevant citations for user query
Done predicting
The impact of temporary cycling infrastructure and “Tactical Urbanist” approaches in London is a complex issue with both positive and negative effects.

Positive impacts include:

The introduction of School Streets, which have shown to promote mode shift towards active modes of travel (Hopkinson et al. 2021) and improve air quality at schools (Air Quality Consultants 2021).
The implementation of temporary cycle lanes and other small-scale projects aimed at improving the smaller residential or local streets in London.
These efforts are part of the Healthy Streets approach, which aims to promote a more sustainable transportation system in London.
However, there have also been negative impacts, including:

Variable outcomes between sites, with some schemes showing little effect (Citation 2).
Criticisms that some projects were implemented too quickly or without adequate consultation, leading to concerns about the speed and process of decision-making.
Vandalism of planters, bollards, and cameras used to prevent through-traffic in some areas (Citation 3).
Removal of Low Traffic Neighbourhoods, especially in Outer London, due to opposition from local residents.
The Temporary City report by Asa Thomas highlights the importance of balancing big change with small impact, emphasizing the need for careful planning and consultation when implementing new transportation projects.

You
What research was done in French cities?

Assistant
Meta-Llama-3.1-8B-Instruct-GGUF
Retrieved 3 relevant citations for user query
Done predicting
The research on French cities during the COVID-19 pandemic focused on understanding how urban planners and policymakers implemented measures to promote cycling and improve public transportation.

A study examined five French cities: Grenoble, Lyon, Montpellier, Rennes, and Bogotá (Citation 1). The study found that these cities had varying levels of population size, density, and surface area. For example, Bogotá was the most populous city with over 7 million inhabitants, while Grenoble had a smaller population of around 160,000.

Another study looked at the implementation of measures in French cities during the pandemic (Citation 2). The research found that some cities focused on improving cycling infrastructure within the city center, such as Lyon and Rennes. In contrast, other cities prioritized links between periurban municipalities or outer suburbs.

A book titled “Changing Bikeability: Everyday Cycling in Developed Territories” explores changing bikeability in French cities during the pandemic (Citation 3). The book examines six French cities: Grenoble, Lyon, Montpellier, Paris, Rennes, and Saint-Étienne. The research found that each city had its unique characteristics and ways of implementing measures to promote cycling.

These studies provide insights into how different types of cities implemented measures to improve cycling infrastructure during the pandemic, and whether these measures were made permanent.

You
Is Bogotá in France?

Assistant
Meta-Llama-3.1-8B-Instruct-GGUF
Retrieved 3 relevant citations for user query
Done predicting
No, Bogotá is not in France. According to Citation 1 and Citation 2, Bogotá is located in Colombia, and it has been compared with four French cities: Grenoble, Lyon, Montpellier, and Rennes.

In fact, the study mentioned in Citation 3 compares the cycling infrastructure in these four French cities (Grenoble, Lyon, Montpellier, and Rennes) with that of Bogotá, a city located in Colombia.

You
Quels ont été les résultats à Grenoble ?

Assistant
Meta-Llama-3.1-8B-Instruct-GGUF
Retrieved 1 relevant citations for user query
Done predicting
Les résultats obtenus à Grenoble sont mentionnés dans la citation :

“Nous avons contacté le Syndicat Mixte des Mobilités de l’Aire Grenobloise et réussi à obtenir la base de données du réseau cyclable. De plus, un stagiaire a effectué une interview avec un technicien de cette organisation, et sur plusieurs occasions, il est allé visiter le site pour voir si les voies temporaires (pop-up tracks) existaient toujours.”

Cela indique que les auteurs ont réussi à collecter des données sur le réseau cyclable de Grenoble en contactant la Syndicat Mixte des Mobilités de l’Aire Grenobloise et en effectuant une interview avec un technicien. Cependant, il n’y a pas d’information sur les résultats concrets de ces efforts.

Cependant, on peut trouver plus d’informations dans le graphique (Figure 8.2) qui montre différents types de voies temporaires installés dans les cinq villes étudiées, dont Grenoble.

39.77 tok/sec

234 tokens

3.34s to first token

Stop: eosFound

Generating music videos using Stable Diffusion

Video generated using Stable Diffusion

In my last post I described how to generate a series of images by feeding back the output of a Stable Diffusion image-to-image model as the input for the next image. I have now developed this into a Generative AI pipeline that creates music videos from the lyrics of songs.

Learning to animate

In my earlier blog about dreaming of the Giro, I saved a series of key frames in a GIF, resulting in an attractive stream of images, but the result was rather clunky. The natural next step was to improve the output by inserting frames to smooth out the transitions between the key frames, saving the result as a video in MP4 format, at a rate of 20 frames per second.

I started experimenting with a series of prompts, combined with the styles of different artists. Salvador Dali worked particularly well for dreamy animations of story lines. In the Dali example below, I used “red, magenta, pink” as a negative prompt to stop these colours swamping the image. The Kandinsky and Miro animations became gradually more detailed. I think these effects were a consequence of the repetitive feedback involved in the pipeline. The Arcimboldo portraits go from fish to fruit to flowers.

Demo app

A created a demo app on Hugging Face called AnimateYourDream. In order to get this to work, you need to duplicate it and then run it using a GPU on your Hugging Face account (costing $0.06 per hour). The idea was to try to recreate a dream I’d had the previous night. You can choose the artistic style, select an option to zoom in, enter three guiding prompts with the desired number of frames and choose a negative prompt. The animation process takes 3-5 minutes on a basic GPU.

For example, setting the style as “Dali surrealist”, zooming in, with 5 frames each of “landscape”, “weird animals” and “a castle with weird animals” produced the following animation.

Demo of my AnimateYourDream app on Hugging Face

Music videos

After spending some hours generating animations on a free Google Colab GPU and marvelling over the animations, I found that the images were brought to life by the music I was playing in the background. This triggered the brainwave of using the lyrics of songs as prompts for the Stable Diffusion model.

In order to produce an effective music video, I needed the images to change in time with the lyrics. Rather than messing around editing my Python code, I ended up using a Excel template spreadsheet as a convenient way to enter the lyrics alongside the time in the track. It was useful to enter “text” as a negative prompt and a sometimes helpful to mention a particular colour to stop it dominating the output. By default an overall style is added to each prompt, but it is convenient to change the style on certain prompts. By default the initial image is used as a “shadow”, which contributes 1% to every subsequent frame, in an attempt to retain an overall theme. This can also be overridden on each prompt.

Finally, it was very useful to be able to define target images. If defined for the initial prompt, this saves loading an additional Stable Diffusion text-to-image pipeline to create the first frame. Otherwise, defining a target image for a particular prompt drags the animation towards the target, by mixing increasing proportions of the target with the current image, progressively from the previous prompt. This is also useful for the final frame of the animation. One way to create target images is to run a few prompts through Stable Diffusion here.

Although some lyrics explicitly mention objects that Stable Diffusion can illustrate, I found it helps to focus on specific key words. This is my template for “No more heroes” by The Stranglers. It produced an awesome video that I put on GitHub.

Once an Excel template is complete, the following pipeline generates the key frames by looping through each prompt and calculating how many frames are required to fill the time until the next prompt for the desired seconds per frame. A basic GPU takes about 3 seconds per key frame, so a song takes about 10-20 minutes, including inserting a smoothing steps between the key frames.

Sample files and a Jupyter notebook are posted on my GitHub repository.

I’ve started a YouTube channel

Having previously published my music on SoundCloud, I am now able to generate my own videos. So I have set up a YouTube channel, where you can find a selection of my work. I never expected the fast.ai course to lead me here.

PyData London

I presented this concept at the PyData London – 76th meetup on 1 August 2023. These are my slides.

Dreaming of the Giro

fast.ai’s latest version of Practical Deep Learning for Coders Part 2 kicks off with a review of Stable Diffusion. This is a deep neural network architecture developed by Stability AI that is able to convert text into images. With a bit of tweaking it can do all sorts of other things. Inspired by the amazing videos created by Softology, I set out to generate a dreamlike video based on the idea of riding my bicycle around a stage of the Giro d’Italia.

Text to image

As mentioned in a previous post, Hugging Face is a fantastic resource for open source models. I worked with one of fast.ai’s notebooks using a free GPU on Google Colab. In the first step I set up a text-t0-image pipeline using a pre-trained version of stable-diffusion-v1-4. The prompt “a treelined avenue, poplars, summer day, france” generated the following images, where model was more strongly guided by the prompt in each row. I liked the first image in the second row, so I decided to make this the first frame in an initial test video.

Stable diffusion is trained in a multimodal fashion, by aligning text embeddings with the encoded versions corresponding images. Starting with random noise, the pixels are progressively modified in order to move the encoding of the noisy image closer to something that matches the embedding of the text prompt.

Zooming in

The next step was to simulate the idea of moving forward along the road. I did this by writing a simple two-line function, using fast.ai tools, that cropped a small border off the edge of the image and then scaled it back up to the original size. In order to generate my movie, rather that starting with random noise, I wanted to use my zoomed-in image as the starting point for generating the next image. For this I needed to load up an image-to-image pipeline.

I spent about an hour experimenting with with four parameters. Zooming in by trimming only a couple of pixels around the edge created smoother transitions. Reducing the strength of additional noise enhanced the sense of continuity by ensuring that that subsequent images did not change too dramatically. A guidance scale of 7 forced the model to keep following prompt and not simply zoom into the middle of the image. The number of inference steps provided a trade-off between image quality and run time.

When I was happy, I generated a sequence of 256 images, which took about 20 minutes, and saved them as a GIF. This produced a pleasing, constantly changing effect with an impressionist style.

Back to where you started

In order to make the GIF loop smoothly, it was desirable to find a way to return to the starting image as part of the continuous zooming in process. At first it seemed that this might be possible by reversing the existing sequence of images and then generating a new sequence of images using each image in the reversed list as the next starting point. However, this did not work, because it gave the impression of moving backwards, rather than progressing forward along the road.

After thinking about the way stable diffusion works, it became apparent that I could return to the initial image by mixing it with the current image before taking the next step. By progressively increasing the mixing weight of the initial image, the generated images became closer to target over a desired number of steps as shown below.

Putting it al together produced the following video, which successfully loops back to its starting point. It is not a perfect animation, because the it zooms into the centre, whereas the vanishing point is below the centre of the image. This means we end up looking up at the trees at some points. But overall it had the effect I was after.

A stage of the Giro

Once all this was working, it was relatively straightforward to create a video that tells a story. I made a list of prompts describing the changing countryside of an imaginary stage of the Giro d’Italia, specifying the number of frames for each sequence. I chose the following.

[‘a wide street in a rural town in Tuscany, springtime’, 25],

[‘a road in the countryside, in Tuscany, springtime’,25],

[“a road by the sea, trees on the right, sunny day, Italy”,50],

[‘a road going up a mountain, Dolomites, sunny day’,50],

[‘a road descending a mountain, Dolomites, Italy’,25],

[‘a road in the countryside, cypress trees, Tuscany’,50],

[‘a narrow road through a medieval town in Tuscany, sunny day’,50]

These prompts produced the video shown at the top of this post. The springtime blossom in the starting town was very effective and the endless climb up into the sunlit Dolomites looked great. For some reason the seaside prompt did not work, so the sequence became temporarily stuck with red blobs. Running it again would make something different. Changing the prompts offered endless possibilities.

The code to run this appears on my GitHub page. If you have a Google account, you can open it directly in Colab and set the RunTime to GPU. You also need a free Hugging Face account to load the stable diffusion pipelines.

Hugging Face

I have been blown away exploring Hugging Face. It’s a community on a mission “to democratize good machine learning”. It provides access to a huge library of state-of-the-art models. So far I have only scratched the surface of what is available, but this blog gives a sample of things I have tried.

At the time of writing, there were 128,463 pre-trained models covering a huge range of capabilities, including computer vision, natural language processing, audio, tabular, multimodal and reinforcement models. The site is set up to make it incredibly easy to experiment with a demo, download a model, run it in a Jupyter notebook, fine-tune it for a specific task and then add it to the space of machine learning apps created by the community. For example, an earlier blog describes my FilmStars app.

Computer vision with text

This is an example from an app that uses the facebook/detr-resnet-50 model to identify objects in an image. It successfully located eight objects with high confidence (indicated by the numbers), but it was fooled into thinking part of the curved lamppost in front of the brickwork pattern was a tennis racket (you can see why).

Image-to-text models go further by creating captions describing what is in the image. I used an interactive demo to obtain suggested captions from a range of state-of-the-art models. The best result was produced by the GIT-large model, whereas a couple of models perceived a clocktower .

These models can also answer questions about images. Although all of the answers were reasonable, GIT-large produced the best response when I asked “Where is the cyclist?”

The next image is an example of text-based inpainting with CLIPSeg x Stable Diffusion, where I requested that wall should be replaced with an apartment block. The model successfully generated a new image while preserving the cyclist, flowers, arch, background and even the birds on the roof. I had great fun with this app, imagining what my friend’s house will look like, when it eventually emerges from a building site.

Continuing with the theme of image generation, I reversed the image to caption problem, by asking a stable-diffusion-v1-5 model to generate an image from the caption “a cyclist rides away through an old brick archway in a city”. It came up with an image remarkably similar to what we started with, even including a female cyclist.

Do it yourself

HuggingFace provides various ways for you to download any of the models from its library. The easiest way to do this is to set up a free account on kaggle, which offers a Jupyter notebook environment with access to a GPU.

Using a HuggingFace pipeline, you can run a model with three lines of Python code! Pipelines can be set up for the image models above, but this is an example of the code required to run a text-based natural language processing task. It creates and runs a pipeline that summarises text, using a model specifically trained to generate output in the style of SparkNotes.

from transformers import pipeline
summarizer = pipeline("summarization",model="pszemraj/long-t5-tglobal-base-16384-book-summary")
summarizer("""Sample text from a book...""")

This rather morbid sample text produced the output from Python that follows.

The fact that Henry Armstrong was buried did not seem to him to prove that he was dead: he had always been a hard man to convince. That he really was buried, the testimony of his senses compelled him to admit. His posture — flat upon his back, with his hands crossed upon his stomach and tied with something that he easily broke without profitably altering the situation — the strict confinement of his entire person, the black darkness and profound silence, made a body of evidence impossible to controvert and he accepted it without cavil.

But dead — no; he was only very, very ill. He had, withal, the invalid’s apathy and did not greatly concern himself about the uncommon fate that had been allotted to him. No philosopher was he — just a plain, commonplace person gifted, for the time being, with a pathological indifference: the organ that he feared consequences with was torpid. So, with no particular apprehension for his immediate future, he fell asleep and all was peace with Henry Armstrong.

But something was going on overhead. It was a dark summer night, shot through with infrequent shimmers of lightning silently firing a cloud lying low in the west and portending a storm. These brief, stammering illuminations brought out with ghastly distinctness the monuments and headstones of the cemetery and seemed to set them dancing. It was not a night in which any credible witness was likely to be straying about a cemetery, so the three men who were there, digging into the grave of Henry Armstrong, felt reasonably secure.

From One Summer Night by Ambrose Bierce
[{'summary_text': "Henry's body is buried in the cemetery, but it does not seem to make him any more certain that he is dead. Instead, he seems to be completely ill."}]

Having come this far, it takes only a few steps to fine tune the model to match your desired task, put it into a GitHub repository and launch your own app as a fully fledged member of the Hugging Face community. A nice explanation is available at fast.ai lesson 4.

Active Inference

Active Inference is a fascinating and ambitious book. It describes a very general normative approach to understanding the mind, brain and behaviour, hinting at potential applications in machine learning and the social sciences. The authors argue that the ways in which living beings interact with the environment can be modelled in terms of something called the free energy principle.

Active Inference builds on the concept of a Bayesian Brain. This is the idea that our brains continually refine an internal model of the external world, acting as probabilistic inference machines. The internal generative model continually predicts the state of the environment and compares its predictions with the inputs of sensory organs. When a discrepancy occurs, the brain updates its model. This is called perception.

But Active Inference goes further my recognising that living things can interact with their environments. Therefore an alternative way to deal with a discrepancy versus expectations is to do something that modifies the world. This is called action.

Variational Free Energy

Active Inference, Parr, Pezzulo, Friston

Either you change your beliefs to match the world or you change the world to match your beliefs. Active Inference makes this trade off by minimising variational free energy, which improves the match between an organism’s internal model and the external world.

The theory is expressed in elegant mathematical terms that lend themselves to systematic analysis. Minimising variational free energy can be considered in terms of finding a maximum entropy distribution, minimising complexity or reducing the divergence between the internal model and the actual posterior distribution.

Expected free energy

Longer term planning is handled in terms of expected free energy. This is where the consequences of future sequences of actions (policies) are evaluated by predicting the outcomes at each stage. The expected free energy of each policy is converted into a score, with the highest score determining the policy the organism expects to pursue. The process of selecting policies that improve the match with the priors pertaining to favoured states is called learning.

Planning is cast in terms of Bayesian inference. Once again the algebraic framework lends itself to a range of interpretations. For example, it automatically trades off information gain (exploration) against pragmatic value (exploitation). This contrasts with reinforcement learning, which handles the issue more heuristically, by trial and error, combined with the notion of a reward.

Applications

The book describes applications in neurobiology, learning and perception. Although readers are encouraged to apply the ideas to new areas, a full understanding of the subject demands the dedication to battle through some heavy duty mathematical appendices, covering Bayesian inference, partially observed Markov Decision Processes and variational calculus.

Nevertheless the book is filled with thought provoking ideas about how living things thrive in the face of the second law of thermodynamics.

Eddy goes to Hollywood

Should Eddy Merckx win an Oscar? Could the boyish looks of Tadej Pogačar or Remco Evenepoel make it in the movies? Would Mathieu van der Poel’s chiselled chin or Wout van Aert strong features help them lead the cast in the next blockbuster? I built a FilmStars app to find out.

https://sci4-filmstars.hf.space

Building a deep learning model

Taking advantage of the fantastic deep learning library provided by fast.ai, I downloaded and cleaned up 100 photos of IMDb’s top 100 male and female stars. Then I used a free GPU on Kaggle to fine-tune a pre-trained Reset50 neural net architecture to identify movie stars from their photos. It took about 2 hours to obtain an accuracy of about 60%. There is no doubt that this model could be greatly improved, but I stopped at that point in the interest of time. After all, 60% is a lot better than the 0.5% obtained from random guessing. Then I used HuggingFace to host my app. The project was completed in two days with zero outlay for resources.

It is quite hard to identify movie stars, because adopting a different persona is part of the job. This means that actors can look very different from one photo to the next. They also get older: sadly, the sex bombs of the ’60s inevitably become ageing actresses in their sixties. So the neural network really had its work cut out to distinguish between 200 different actors, using a relatively small sample of data and only a short amount of training.

Breaking away

Creating the perfect film star identifier was never really the point of the app. The idea was to allow people to upload images to see which film stars were suggested. If you have friend who looks like Ralph Fiennes, you can upload a photo and see whether the neural net agrees.

I tried it out with professional cyclists. These were the top choices.

Eddy MerckxJames Dean
Tadej PogačarMatt Damon
Remco EvenepoelMel Gibson
Mathieu van der PoelLeonardo DiCaprio
Wout van Aert Brad Pitt
Marianne VosJodie Foster
Ashleigh MoolmanMarion Cotillard
Katarzyna NiewiadomaFaye Dunaway
Anna van der BreggenBrigitte Bardot
Cycling Stars

In each case I found an image of the top choice of film star for comparison.

The model was more confident with the male cyclists, though it really depends on the photo and even the degree of cropping applied to the image. The nice thing about the app is that people like to be compared to attractive film stars, though there are are few shockers in the underlying database. The model does not deal very well with beards and men with long hair. It is best to use a “movie star” type of image, rather than someone wearing cycling kit.

Lord of the (cycling) rings

Which Lord of the Rings characters do they look like? Ask an AI.

After building an app that uses deep learning to recognise Lord of the Rings characters, I had a bit of fun feeding in pictures of professional cyclists. This blog explains how the app works. If you just want to try it out yourself, you can find it here, but note that may need to be fairly patient, because it can take up to 5 minutes to fire up for the first time… it does start eventually.

Identifying wizards, hobbits and elves

The code that performs this task was based on the latest version of the excellent fast.ai course Practical Deep Learning for Coders. If you have done bit of programming in Python, you can build something like this yourself after just a few lessons.

The course sets out to defy some myths about deep learning. You don’t need to have a PhD in computer science – the fastai library is brilliantly designed and easy to use. Python is the language of choice for much of data science and the course runs in Jupyter notebooks.

You don’t need petabytes of data – I used fewer than 150 sample images of each character, downloaded using the Bing Image Search API. It is also straightforward to download publicly available neural networks within the fastai framework. These have been pre-trained to recognise a broad range of objects. Then it is relatively quick to fine-tune the parameters to achieve a specific task, such as recognising about 20 different Tolkien characters.

You don’t need expensive resources to build your models – I trained my neural network in just a few minutes, using a free GPU available on Google’s Colaboratory platform. After transferring the essential files to a github repository, I deployed the app at no cost, using Binder.

Thanks to the guidance provided by fastai, the whole process was quick and straightforward to do. In fact, by far the most time consuming task was cleaning up the data set of downloaded images. But there was a trick for doing this. First you train your network on whatever images come up in an initial search, until it achieves a reasonable degree of accuracy. Then take a look at the images that the model finds the most difficult to classify. I found that these tended to be pictures of lego figures or cartoon images. With the help of a fastai tool, it was simple to remove irrelevant images from the training and validation sets.

After a couple of iterations, I had a clean dataset and a great model, giving about 70% accuracy, which as good enough my purposes. Some examples are shown in the left column at the top of this blog.

The model’s performance was remarkably similar to my own. While Gollum is easy to identify, the wizard Saruman can be mistaken for Gandalf, Boromir looks a bit like Faramir and the hobbits Pippin and Merry can be confused.

Applications outside Middle Earth

One of the important limits of these types of image recognition models is that even if they work well in the domain in which they have been trained, they cannot be expected do a good job on totally different images. Nevertheless, I thought it would be amusing to supply the pictures of professional cyclists, particularly given the current vogue for growing facial hair.

My model was 87% sure that Peter Sagan was Boromir, but only 81.5% confident in the picture of Sean Bean. It was even more certain that Daniel Oss played the role of Faramir. Geraint Thomas was predicted to be Frodo Baggins, but with much lower confidence. I wondered for a while with Tadej Pogacar should be Legolas, but perhaps the model interpreted his outstretched arms as those of an archer.

I hoped that a heavily bearded Bradley Wiggins might come out as Gimli, but that did not not seem to work. Nevertheless it was entertaining to upload photographs of friends and family. With apologies for any waiting times to get to it running, you can try it here.

In earlier blogs, I have described similar models to identify common flowers or different types of bike.

Predicting the World Champion

A couple of years ago I built a model to evaluate how Froome and Dumoulin would have matched up, if they had not avoided racing against each other over the 2017 season. As we approach the 2019 World Championships Road Race in Yorkshire, I have adopted a more sophisticated approach to try to predict the winner of the men’s race. The smart money could be going on Sam Bennett.

Deep learning

With only two races outstanding, most of this year’s UCI world tour results are available. I decided to broaden the data set with 2.HC classification European Tour races, such as the OVO Energy Tour of Britain. In order to help with prediction, I included each rider’s weight and height, as well as some meta-data about each race, such as date, distance, average speed, parcours and type (stage, one-day, GC, etc.).

The key question was what exactly are you trying to predict? The UCI allocates points for race results, using a non-linear scale. For example, Mathieu Van Der Poel was awarded 500 points for winning Amstel Gold, while Simon Clarke won 400 for coming second and Jakob Fuglsang picked up 325 for third place, continuing down to 3 points for coming 60th. I created a target variable called PosX, defined as a negative exponential of the rider’s position in any race, equating to 1.000 for a win, 0.834 for second, 0.695 for third, decaying down to 0.032 for 20th. This has a similar profile to the points scheme, emphasising the top positions, and handles races with different numbers of riders.

A random forest would be a typical choice of model for this kind of data set, which included a mixture of continuous and categorical variables. However, I opted for a neural network, using embeddings to encode the categorical variables, with two hidden layers of 200 and 100 activations. This was very straightforward using the fast.ai library. Training was completed in a handful of seconds on my MacBook Pro, without needing a GPU.

After some experimentation on a subset of the data, it was clear that the model was coming up with good predictions on the validation set and the out-of-sample test set. With a bit more coding, I set up a procedure to load a start list and the meta-data for a future race, in order to predict the result.

Predictions

With the final start list for the World Championships Road Race looking reasonably complete, I was able to generate the predicted top 10. The parcours obviously has an important bearing on who wins a race. With around 3600m of climbing, the course was clearly hilly, though not mountainous. Although the finish was slightly uphill, it was not ridiculously steep, so I decided to classify the parcours as rolling with a flat finish

PositionRiderPrediction
1Mathieu Van Der Poel0.602
2Alexander Kristoff0.566
3Sam Bennett0.553
4Peter Sagan0.540
5Edvald Boasson Hagen0.507
6Greg Van Avermaet0.500
7Matteo Trentin0.434
8Michael Matthews0.423
9Julian Alaphilippe0.369
10Mike Teunissen0.362

It was encouraging to see that the model produced a highly credible list of potential top 10 riders, agreeing with the bookies in rating Mathieu Van Der Poel as the most likely winner. Sagan was ranked slightly below Kristoff and Bennett, who are seen as outsiders by the pundits. The popular choice of Philippe Gilbert did not appear in my top 10 and Alaphilippe was only 9th, in spite of their recent strong performances in the Vuelta and the Tour, respectively. Riders in positions 5 to 10 would all be expected to perform well in the cycling classics, which tend to be long and arduous, like the Yorkshire course.

For me, 25/1 odds on Sam Bennett are attractive. He has a strong group of teammates, in Dan Martin, Eddie Dunbar, Connor Dunne, Ryan Mullen and Rory Townsend, who will work hard to keep him with the lead group in the hillier early part of the race. Then he will then face an extremely strong Belgian team that is likely to play the same game that Deceuninck-QuickStep successfully pulled off in stage 17 of the Vuelta, won by Gilbert. But Bennett was born in Belgium and he was clearly the best sprinter out in Spain. He should be able to handle the rises near the finish.

A similar case can be made for Kristoff, while Matthews and Van Avermaet both had recent wins in Canada. Nevertheless it is hard to look past the three-times winner Peter Sagan, though if Van Der Poel launches one of his explosive finishes, there is no one to stop him pulling on the rainbow jersey.

Appendix

After the race, I checked the predicted position of the eventual winner, Mads Pedersen. He was expected to come 74th. Clearly the bad weather played a role in the result, favouring the larger riders, who were able to keep warmer. The Dane clearly proved to be the strongest rider on the day.

References

Code used for this project

Sunflowers

Image in the style of @grandtourart

Last year, I experimented with using style transfer to automatically generate images in the style of @grandtourart. More recently I developed a more ambitious version of my rather simple bike identifier. The connection between these two projects is sunflowers. This blog describes how I built a flower identification app.

In the brilliant fast.ai Practical Deep Learning for Coders course, Jeremy Howard recommends downloading a publicly available dataset to improve one’s image categorisation skills. I decided to experiment with the 102 Category Flower Dataset, kindly made available by the Visual Geometry Group at Oxford University. In the original 2008 paper, the researchers used a combination of techniques to segment each image and characterise its features. Taking these as inputs to a Support Vector Machine classifier, their best model achieved an accuracy of 72.8%.

Annoyingly, I could not find a list linking the category numbers to the names of the flowers, so I scraped the page showing sample images and found the images in the labelled data.

Using exactly the same training, validation and test sets, my ResNet34 model quickly achieved an accuracy of 80.0%. I created a new branch of the GitHub repository established for the Bike Image model and linked this to a new web service on my Render account. The huge outperformance of the paper was satisfying, but I was sure that a better result was possible.

The Oxford researchers had divided their set of 8,189 labelled images into a training set and a validation set, each containing 10 examples of the 102 flowers. The remaining 6,149 images were reserved for testing. Why allocate less that a quarter of the data to training/validation? Perhaps this was due to limits on computational resources available at the time. In fact, the training and validation sets were so small that I was able to train the ResNet34 on my MacBook Pro’s CPU, within an acceptable time.

My plan to improve accuracy was to merge the test set into the training set, keeping aside the original validation set of 1,020 images for testing. This expanded training set of 7,261 images immediately failed on my MacBook, so I uploaded my existing model onto my PaperSpace GPU, with amazing results. Within 45 minutes, I had a model with 97.0% accuracy on the held-out test set. I quickly exported the learner and switched the link in the flowers branch of my GitHub repository. The committed changes automatically fed straight through to the web service on Render.

I discovered, when visiting the app on my phone, that selecting an image offers the option to take a photo and upload it directly for identification. Having exhausted the flowers in my garden, I have risked being spotted by neighbours as I furtively lean over their front walls to photograph the plants in their gardens.

Takeaways

It is very efficient to use smaller datasets and low resolution images for initial training. Save the model and then increase resolution. Often you can do this on a local CPU without even paying for access to a GPU. When you have a half decent model, upload it onto a GPU and continue training with the full dataset. Deploying the model as a web service on Render makes the model available to any device, including a mobile phone.

My final model is amazing… and it works for sunflowers.

References

Automated flower classification over a large number of classes, Maria-Elena Nilsback and Andrew Zisserman, Visual Geometry Group, Department of Engineering Science, University of Oxford, United Kingdom, men,az@robots.ox.ac.uk

102 Flowers Jupyter notebook

Bike Identification as a web app

One of the first skills acquired in the latest version of the fast.ai course on deep learning is how to create a production version of an image classifier that runs as a web application. I decided to test this out on a set of images of road bikes, TT bikes and mountain bikes. To try it out, click on the image above or go to this website https://bike-identifier.onrender.com/ and select an image from your device. If you are using a phone, you can try taking photos of different bikes, then click on Analyse to see if they are correctly identified. Side-on images work best.

How does it work?

The first task was to collect some sample images for the three classes of bicycles I had chosen: road, TT and MTB. It turns out that there is a neat way to obtain the list of urls for a Google image search, by running some javascript in the console. I downloaded 200 images for each type of bike and removed any that could not be opened. This relatively small data set allowed me to do all the machine learning using the CPU on my MacBook Pro in less than an hour.

The fast.ai library provides a range of convenient ways to access images for the purpose of training a neural network. In this instance, I used the default option of applying transfer learning to a pre-trained ResNet34 model, scaling the images to 224 pixel squares, with data augmentation. After doing some initial training, it was useful to look at the images that had been misclassified, as many of these were incorrect images of motorbikes or cartoons or bike frames without wheels or TT bars. Taking advantage of a useful fast.ai widget, I removed unhelpful training images and trained the model further.

The confusion matrix showed that final version of my model was running at about 90% accuracy on the validation set, which was hardly world-beating, but not too bad. The main problem was a tendency to mistake certain road bikes for TT bikes. This was understandable, given the tendency for road bikes to become more aero, though it was disappointing when drop handlebars were clearly visible.

The next step was to make my trained network available as a web application. First I exported the models parameter settings to Dropbox. Then I forked a fast.ai repository into my GitHub account and edited the files to link to my Dropbox, switching the documentation appropriately for bicycle identification. In the final step, I set up a free account on Render to host a web service linked to my GitHub repository. This automatically updates for any changes pushed to the repository.

Amazingly, it all works!

References

fast.ai lesson 2

My GitHub repository, include Jupyter notebook