
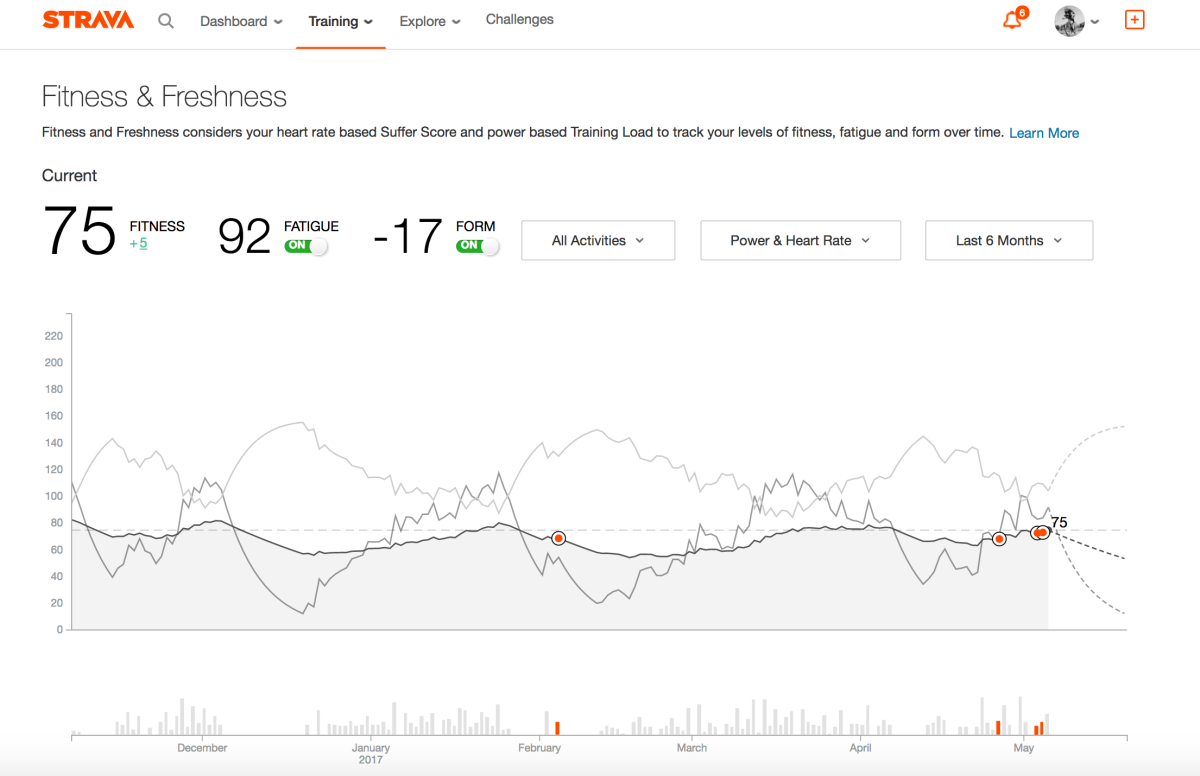
The last blog explored the statistics that Strava calculates for each ride. These feed through into the Fitness & Freshness chart provided for premium users. The aim is to show the accumulated effect of training through time, based on the Training-Impulse model originally proposed by Eric Banister and others in a rather technical paper published in 1976.
Strava gives a pretty good explanation of Fitness and Freshness. A similar approach is used on Training Peaks in its Performance Management Chart. On Strava, each ride is evaluated in terms of its Training Load, if you have a power meter, or a figure derived from your Suffer Score, if you just used a heart rate monitor. A training session has a positive impact on your long-term fitness, but it also has a more immediate negative effect in terms of fatigue. The positive impact decays slowly over time, so if you don’t keep up your training, you lose fitness. But your body is able to recover from fatigue more quickly.
The best time to race is when your fitness is high, but you are also sufficiently recovered from fatigue. Fitness minus fatigue provides an estimate of your form. The 1976 paper demonstrated a correlation between form and the performance of an elite swimmers’ times over 100m.
The Fitness and Freshness chart is particularly useful if you are following a periodised training schedule. This approach is recommended by many coaches, such as Joe Friel. Training follows a series of cycles, building up fitness towards the season’s goals. A typical block of training includes a three week build-up, followed by a recovery week. This is reflected in a wave-like pattern in your Fitness and Freshness chart. Fitness rises over the three weeks of training impulses, but fatigue accumulates faster, resulting in a deterioration of form. However, fatigue drops quickly, while fitness is largely maintained during the recovery week, allowing form to peak.
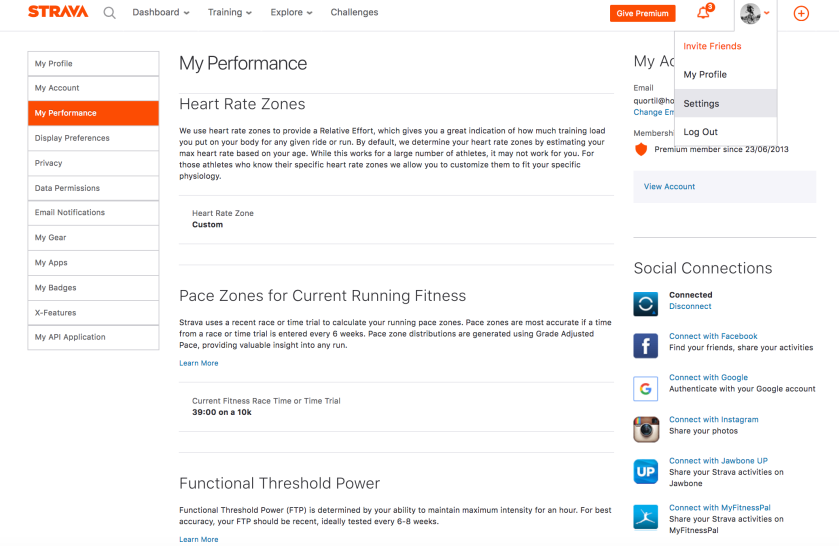
In order to make the most of the Fitness and Freshness charts, it is important that you use an accurate current figure for your Functional Threshold Power. The best way to do this is to go and do a power test. It is preferable to follow a formal protocol that you can repeat, such as that suggested by British Cycling. Alternatively, Strava premium users can refer to the Strava Power Curve. You can either take your best effort over 1 hour or 95% of your best effort over 20 minutes. Or you can click on the “Show estimated FTP” button and take the lower figure. In order for this to flow through into your Fitness and Freshness chart, you need to enter your 1 hour FTP into your personal settings, under “My Performance”.
The example chart at the top of this blog shows how my season has panned out so far. After taking a two week break before Christmas, I started a solid block of training in January. My recovery week was actually spent skiing (pretty hard), though this did not register on Strava because I did not use a heart rate monitor. So the sharp drop in fatigue at the end of January is exaggerated. Nevertheless, my form was positive for my first race on 4 February. Unfortunately, I was knocked off and smashed a few ribs, forcing me to take an unplanned two week break. By the time I was able to start riding tentatively, rather than starting from an elevated level, my fitness had deteriorated to December’s trough.
After a solid, but still painful, block of low intensity training in March, I took another “recovery week” on the slopes of St Anton. I subsequently picked up a cold that delayed the start of the next block of training, but I have incorporated some crit races into my plan, for higher intensity sessions. If you edit the activity and make the “ride type” a “race”, it shows up as a red dot on the chart. Barring accident and illness, the hope is to stick more closely to a planned four-week cycle going forward.
This demonstrates how Strava’s tools reveal the real-life difficulties of putting the theoretical benefits of periodisation into practice.
Related posts
See other blogs on Strava Power Curve, Strava Ride Statistics or going for a Strava KOM.

Thank you for this and all your articles. One important aspect of this subject, or perhaps a topic for another day, is to know how suffer score/training load are derived. For example, I recently notice that my runs were generating a lot of fitness, while bike efforts of similar length and intensity were not. I found that my Strava max HR was not set properly (way too high), and my intense efforts at Threshold+ pm the bike were registering as little more than zone 1 rides.
Bottom line is garbage-in, garbage-out. These are good metrics, but if you want to use them, you need to make sure all the parameters are set properly.
LikeLike
Thanks for the comment. You are absolutely right that, in order to make use of the charts and metrics, you need to maintain correct calibrations of the key parameters, like heart rate and FTP.
LikeLike
Fitness and Freshness is completely useless. Why? Because if you update your FTP or max heart rate, the F&F graph completely refreshes for your entire history as if the new FTP has always been there. So the old rides which might have been strenuous now are “easy” and give very little benefit to Fitness. Strava knows about this bug and has known about it for YEARS and still won’t fix it. Since any change in FTP completely rewrites history, it makes any meaningful assessment of trends and evolving fitness impossible.
See here for example:
https://support.strava.com/hc/en-us/community/posts/203479564-Changing-FTP-changes-all-previous-training-score-data
LikeLike
Do you know what the units of fitness, freshness, and fatigue are? When you adjust FTP does the whole chart adjust or does Strava recognize variable FTP over time and adjust the chart accordingly. Is the top end FTP based on your best recorded FTP?
LikeLike
They’re Strava’s own unit of strain scoring. They have no real correlation to anything else that I can find. However, unfortunately yes, if you adjust your FTP the entire chart will recalculate as if that has always been your FTP, same with heart rate. So if you do a ride in 2000 that is strenuous because of your FTP of 150 and then do a ride in 2019 with a new FTP of 250, your 2000 ride will have it’s strain score downgraded as if you had an FTP of 250 at the time. You can enter whatever FTP you want to enter, Strava doesn’t verify it or require it be based on any recorded ride.
LikeLike
I believe that Strava’s calculations are based on the original Banister paper. Fitness and Fatigue are time weighted averages of daily Training Loads, with Form being the Fitness minus Fatigue. The Training Load is the square of Intensity Factor times the number of hours in the ride times 100, where Intensity Factor is Weighted Average Power divided by FTP. So two hours riding at a WAP of half your FTP creates a Training Load of 50. Since Intensity Factor is dimensionless, Training Load has the dimensions of time. So to answer your question, the three Fs are expressed in slightly odd time units.
LikeLike