Human Blood Protein Atlas

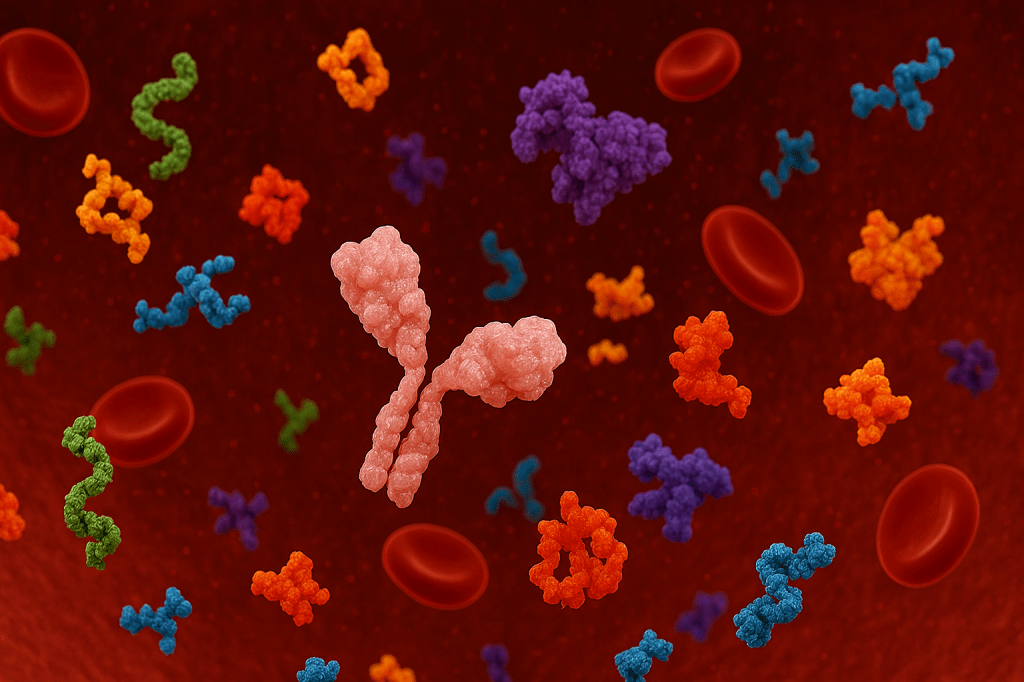
A recent report in Science announced the publication of a new human blood protein atlas, describing the disease signatures of thousands of proteins circulating in the blood. Minimally invasive protein profiling marks a step forward in the personalisation of medicine. Some interesting statistical and machine learning techniques were employed.

Blood Protein Study

The researchers’ methods included a technique called proximity extension assay (PEA), which makes use of highly specific probes of DNA strands to detect minute concentrations of proteins in the blood plasma. Amplification with PCR (Polymerase Chain Reactions) allowed 5,416 proteins to be evaluated.

A longitudinal dataset showed dramatic changes as children passed through adolescence to adulthood. The central part of the study was a cross-sectional analysis, where age, sex and BMI were identified as important explanatory factors. The signatures of 59 clinically relevant diseases, in seven classes, can be viewed interactively in The Human Protein Atlas.

Into the secretome

Rather than the hideaway of a reclusive cockney, the secretome refers to the ensemble of secreted proteins. From a data science perspective, the challenge was how to find the signatures of a wide range of diseases, based on the differential abundance of over 5,400 proteins. This was complicated by the fact that many proteins elevated by a particular disease were also found to be elevated in other diseases.

“To investigate the distinct and shared proteomics signatures across diseases, we performed differential abundance analyses. Several groups were used as controls, including healthy samples, a disease background consisting of all other diseases, and samples from the same disease class.”

From The Human Protein Atlas

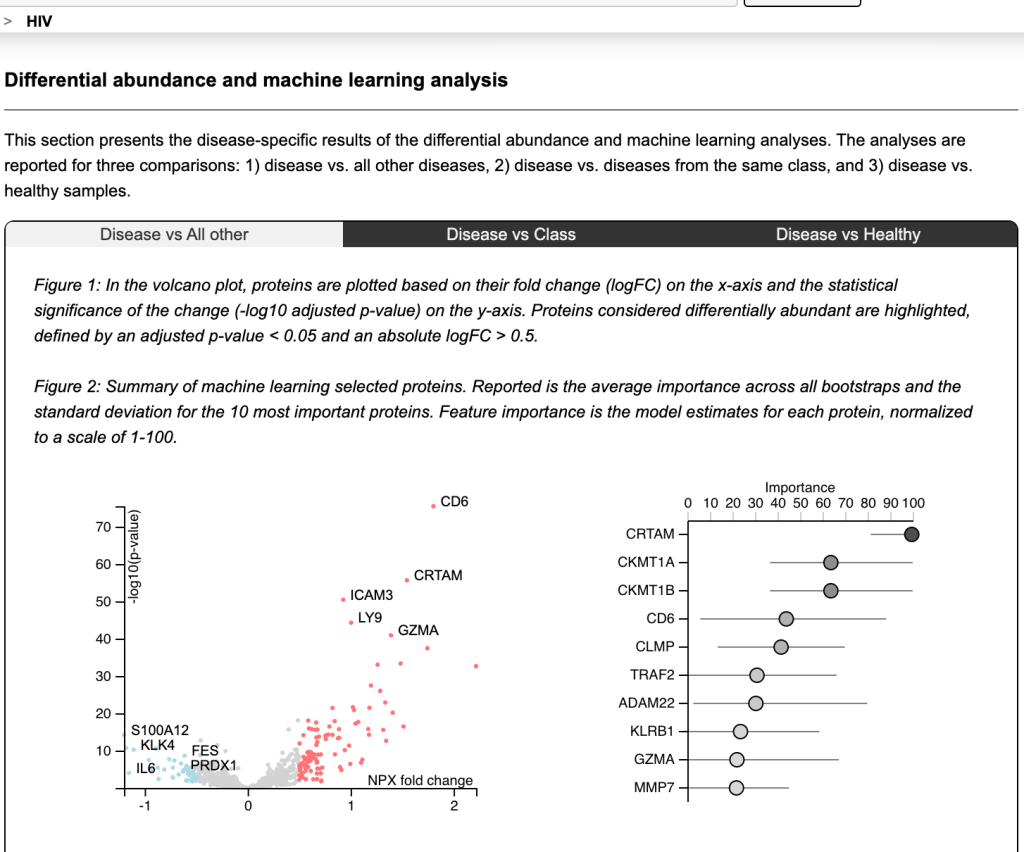
The differential abundance of proteins was evaluated using normalised protein expression units (NPX). The volcano chart above plots the p-values against the multiplicative (fold) change in NPX, both on log scales. The red values on the right were unusually high and the blue values on the left was exceptionally low.

The researchers used a logistic LASSO approach to identify the importance of proteins in providing a signature of each disease against its cohort. In the case of HIV above, CRTAM was the most significant explanatory factor, even though CD6 had the most extreme p-value.

How does logistic LASSO work?

A logistic model is trained on target values of one or zero, in this case representing the presence or absence of a disease. Least absolute shrinkage and selection operator (LASSO) is a version of linear regression that selects the most relevant explanatory variables using L1 regularisation. Adding the sum of the absolute values of the regression coefficients to the objective function forces the contribution of irrelevant variables towards zero as the hyper-parameter, λ, is increased. This property was particularly useful for the disease signature problem, where there were thousands of potential explanatory proteins.

The tricky aspect of LASSO is tuning the hyper-parameter, λ. You want it to be high enough to eliminate irrelevant variables, but not so high that it discounts the useful explanatory features. In the protein study, this was addressed using cross-validation: randomly splitting the data into 70:30 training and test sets, then rerunning the regression for a range of λ values. The quality of a model can be assessed in terms of both its accuracy and its required number of inputs, using criteria such as the Akaike information criterion or Bayesian information criterion, which favour parsimony. Repeating the randomisation 100 times, the researchers could home in on an optimal value of λ. The regression coefficients of the resulting model could then be used to rank the importance of the relevant proteins, as shown in the right hand side of the panel above.

Personalised health

The potential for a cheap, annual blood test to screen the whole population is immense. Proteomics adds to the arsenal of resources available to help people stay healthy. Early indications of diseases like cancer can be critical in initiating treatment. There is plenty of room to broaden the scope beyond the current 59 diseases, to include rarer conditions, such as Motor Neurone Disease, which has impacted some top sportsmen. It would be extremely helpful to find proteins related to the apparent epidemic of mental health issues, which are hard to define and lack objective, quantitative diagnostic criteria.

PEAQ Performance

If you are a cyclist, athlete, dancer or exerciser struggling to reach your full potential, your might have a mismatch between your training and what you are eating. Persistently running an energy deficit can have an adverse impact on your health and performance, sometimes leading to a condition called Relative Energy Deficiency in Sport (REDs). Optimal training adaptations and peak achievements rely on consistently fuelling for the work required.

I have created an app that generates a score based on a short Personal Energy Availability Questionnaire (PEAQ) designed to identify people at risk.

Personal Energy Availability Questionnaire (PEAQ)

The PEAQ is based on research published in BMJ Open Sport & Exercise Medicine, exploring the relationship between a REDs score derived from the questionnaire and quantified clinical consequences of low energy availability. A similar approach has been used in other research.

The app automates the scoring process and generates a free downloadable report that includes graphics and an interpretation of your result. It takes a few minutes to fill in your answers and the process is anonymous.

The report breaks down the overall score into three health categories. Physical health is based on body mass index (BMI) and injuries. Physiological factors include hormones, sleep and nutrition. Psychological wellbeing relates to habits and anxiety.

Relative energy deficiency

REDs is not confined to top athletes. It can occur in men and women of any age, at all levels of performance, across a spectrum of activities, including sports, exercise and dance.

Relative energy deficits can result from deliberate under-fuelling, particularly in activities where low body weight confers an aesthetic or performance advantage (dance, cycling, climbing, running etc.). Relative energy deficits can also arise, sometimes unintentionally, as a result of stepping up one’s training load without a corresponding increase in energy intake.

Health and performance risks

For evolutionary reasons, your body prioritises movement in the allocation of its energy budget. Energy availability is a measure of the amount of energy left over for day-to-day physiological processes: breathing, digestion, repair, brain function etc.. In an energy deficit, your body switches off inessential processes, such as reproduction. Poor bone health is one of the consequences of a reduction in sex steroid hormones. Other effects of low energy availability include fatigue, disrupted sleep and digestive problems.

For active people, low energy availability reduces your ability to perform high quality training/exercise and depletes your body’s ability to deliver the desired positive adaptations, such as muscle strength and endurance capacity.

Take a PEAQ

Please take advantage of the PEAQ. If you have worries or concerns about your results, Dr Nicky Keay offers personalised health advisory appointments. You can find valuable resources at BASEM.

Technical points

I built this educational health app in Python. It is hosted on the Streamlit Community Cloud. The code is on my GitHub page.

References

Mountjoy M, Ackerman KE, Bailey DM et al 2023 International Olympic Committee’s (IOC) consensus statement on Relative Energy Deficiency in Sport (REDs) British Journal of Sports Medicine 2023;57:1073-1098
Keay N Hormones, Health and Human Potential: A guide to understanding your hormones to optimise your health and performance, Sequoia books 2022
Keay N, Francis G, AusDancersOverseas Indicators and correlates of low energy availability in male and female dancers. BMJ Open in Sports and Exercise Medicine 2020
Nicolas J, Grafenuer S. Investigating pre-professional dancer health status and preventative health knowledge Front. Nutr. Sec. Sport and Exercise Nutrition. 2023 (10)
Keay N, Francis G. Longitudinal investigation of the range of adaptive responses of the female hormone network in pre- professional dancers in training March 2025 ResearchGate DOI: 10.13140/RG.2.2.30046.34880
Keay N. Current views on relative energy deficiency in sport (REDs). Focus Issue 6: Eating disorders. Cutting Edge Psychiatry in Practice CEPiP. 2024.1.98-102
Assessment of Relative Energy Deficiency in Sport, Malnutrition Prevalence in Female Endurance Runners by Energy Availability Questionnaire, Bioelectrical Impedance Analysis and Relationship with Ovulation status. Clinical Nutrition Open Science 2025S.
Sharp S, Keay N, Slee A. Body composition, malnutrition, and ovulation status as RED-S risk assessors in female endurance athletes, Clinical Nutrition ESPEN 2023, 58 :720-721
Keay N, Craghill E, Francis G Female Football Specific Energy Availability Questionnaire and Menstrual Cycle Hormone Monitoring. Sports Injr Med 2022; 6: 177
Nicola Keay, Martin Lanfear, Gavin Francis. Clinical application of monitoring indicators of female dancer health, including application of artificial intelligence in female hormone networks. Internal Journal of Sports Medicine and Rehabilitation, 2022; 5:24.
Nicola Keay, Martin Lanfear, Gavin Francis. Clinical application of interactive monitoring of indicators of health in professional dancers J Forensic Biomech, 2022, 12 (5) No:1000380
Keay, Francis, Hind Low energy availability assessed by a sport-specific questionnaire and clinical interview indicative of bone health, endocrine profile and cycling performance in competitive male cyclists BMJ Open Sports and Exercise Medicine 2018
Keay, Francis, Hind Clinical evaluation of education relating to nutrition and skeletal loading in competitive male road cyclists at risk of relative energy deficiency in sports (RED-S): 6-month randomised controlled trial BMJ Open Sports and Exercise Medicine 2019
Keay, Francis, Hind Bone health risk assessment in a clinical setting: an evaluation of a new screening tool for active populations MOJSports Medicine 2022;5(3):84-88. doi: 10.15406/mojsm.2022.05.00125″

Relative Energy Deficit in Sport (RED-S)

EnergyBalance

Unfortunately an increasing proportion of the population of western society has fallen into the habit consuming far more calories than required, resulting an a huge increase in obesity, with all the associated negative health consequences. At the opposite end of the spectrum, a smaller but important group experiences problems stemming from insufficient energy intake. This group includes certain competitive athletes, especially those involved in sports or dance, where a low body weight confers a performance advantage. A new infographic draws attention to this problem and highlights the fact that the individuals have control over the factors that can put them on the path to optimal health and performance.

RED-S

The human body requires a certain amount of energy to perform normal metabolic functions, including, maintaining homeostasis, cardiac and brain activity. The daily requirement is around 2,000 kcal for women and 2,500 kcal for men. Additional energy intake is required to balance the energy requirements any physical activities performed.

Athletes and dancers need to eat more than sedentary people, but they can fall into an energy deficit in two ways.

  • Reducing energy intake, while maintaining the same training load. This is typically an intentional decision, in order to lose weight, in the belief that this might improve performance. It can also arise unintentionally, perhaps due to failing to calculate energy demands of the training programme.
  • Increasing training load, while maintaining the same energy intake. This can often occur unintentionally, as a result of a more intensive training session or a shift into a higher training phase. Some athletes or dancers perform extra training sessions while deliberately failing to eat more, in the hope, once again, that this might improve performance.

While most of the population would benefit from a period of moderate energy deficit. High level athletes and dancers tend to be very lean, to the extent that losing further weight compromises health and performance. The reason is that the endocrine system is forced to react to an energy deficit by scaling back or shutting down key metabolic systems. For example, levels of the sex hormones testosterone and oestrogen can fall, leading to, among other things, reductions in bone density. Unlike men, women have a warning sign, in the form of an interruption or cessation of menstruation. Both men and women with RED-S are likely to suffer from a failure to achieve their peak athletic performance.

Achieving peak performance

Fortunately athletes have control over the levers that lead to peak performance. These are nutrition, training load and, of course, recovery. Consistently fuelling for the energy required, whilst ensuring that the body has adequate time to recover, allows the endocrine system to trigger the genes that lead to the beneficial outcomes of exercise, such as improved cardiovascular efficiency, effective muscular development, optimal body composition, healthy bones and a fully functional immune system. These are the changes required to reach the highest levels of performance.

Screenshot 2019-04-08 at 12.19.45


Don’t ride your bike like an astronaut

Screenshot 2019-04-05 at 17.13.59

Astronauts return from the International Space Station with weak bones, due to the lack of gravitational forces. It is surprising to learn that competitive cyclists can experience similar losses in bone density over the period of a race season.

The problem is called Relative Energy Deficiency is Sport (RED-S). This occurs when lean athletes reach a tipping point where the benefits of losing weight become overwhelmed by negative impacts on health. When deprived of sufficient energy intake to match training load, certain metabolic systems become impaired or shut down.

Colleagues from Durham University and I recently published a study investigating what cyclists at risk of RED-S can do to improve their health and performance. It is freely available and written in an accessible way, without the requirement for specialist expertise.

Race performance

Race performance was measured by the number of British Cycling points accumulated over the season. This was correlated with power (FTP and FTP/kg) and training load. However, changes in energy availability proved to be an important factor. After adjusting for FTP, cyclists who improved their fuelling (green triangles) gained, on average, 95 points more than those who made no change. In contrast, those who restricted their nutrition (red crosses) accumulated 95 fewer points and reported fatigue, illness and injury.

Figure2 600
Race Performance versus FTP and changes in Energy Availability (EA)

The nutritional advice included recommendations on adequate fuelling before, during and after rides. Also see my previous article on fuelling for the work required.

Bone health

Competitive road cyclists can fall into an energy deficit due to the long hours of training they complete. Although an initial loss of excess body weight can lead to performance improvements, athletes need to maintain a healthy body mass. The lumbar spine is particularly sensitive to deficiencies of energy availability.

In cyclists, the lower back also fails to benefit from the gravitational stresses of weight-bearing sports. This is why, in addition to nutritional advice, study participants were recommended some basic skeletal loading exercises (yes, that is me in the pictures).

The cyclists fell into three general groups: those who made positive changes to nutrition and skeletal loading, those who made negative changes and the remainder. The resulting changes in bone mineral density over a six month period were striking, with highly statistically significant differences observed between the groups.

Those making positive changes (green triangles) saw significant gains in bone mineral density, while those making negative changes (red crosses) saw equally significant negative losses in bone density. Any individual observation outside the band of the least significant change (LSC) is indicative of a material change in bone health.

Figure1 600
Changes in Lumbar Bone Mineral Density versus Behaviour Changes

Conclusions

The study provided strong evidence of the benefits of positive changes and the costs of negative changes in nutrition and skeletal loading exercises. It was noted that certain cyclists found it hard to overcome psychological barriers preventing them from deviating from their current routines. It is hoped that such strong statistical results will help these vulnerable athletes make beneficial behavioural changes

References

Clinical evaluation of education relating to nutrition and skeletal loading in competitive male road cyclists at risk of relative energy deficiency in sports (RED-S): 6-month randomised controlled trial, Nicola Keay, Gavin Francis, Ian Entwistle, Karen Hind. BMJ Open Sport and Exercise Medicine Journal, Volume 5, Issue 1. http://dx.doi.org/10.1136/bmjsem-2019-000523


Fuel for the work required: periodisation of carbohydrate intake

screenshot2019-01-31at16.06.16
Fuel for the work required, Impey et al, Sports Med (2018) 48:1031–1048

Last week I attended an event announcing the forthcoming launch of a new fitness app called Pillar. It offers combined training and nutrition advice to help athletes achieve their goals. Pillar is backed by a strong scientific team including Professor James Morton, Team Sky Head of Performance Nutrition, and Professor Graeme Close, England Rugby Head of Performance Nutrition.

James Morton gave a fascinating presentation about the periodisation of carbohydrate (CHO) fuelling, including a detailed description of the nutrition strategy he created to support Chris Froome’s famous 80km attack on stage 19 of the 2018 Giro d’Italia. His recent paper explains the underlying science. These are some of the key points.

  • Always go into competition fully fuelled with carbohydrate
    • Well-fuelled athletes perform for longer at higher intensities than those with depleted reserves
    • Basic biochemistry: fat burning is too slow and supplies of the phosphocreatine are too small to sustain intensities over 85% of VO2max
    • Theory is backed up by experiment
  • There are pros and cons to training with low levels of carbohydrate
    • Positive effects: Improved fat burning, changes in cell signalling, gene expression and enzyme/protein activity, potential to save precious glycogen stores for crucial attacks later in a race
    • Negative effects: Inconsistent evidence of improved performance, ability to complete training session may be compromised, reduced immunity, risks to bone health, loss of top end for those on high fat/low carb (ketogenic) diet
  • Different ways to train with low carbohydrate
    • doing two sessions in one day with minimal refuelling
    • low carb evening meal and breakfast: sleep low, train low the next morning
    • fasted rides
    • high fat/low carb diet

Is there a structured method of training that provides the benefits without the negatives?

  • The authors propose a glycogen threshold hypothesis
    • Positive effects seem to be dependent on commencing with muscle glycogen levels within a specific range
    • Levels have to be low enough to promote positive effects
    • But when too low, protein synthesis may be impaired and the ability to complete sessions is compromised
  • This leads to the idea of periodising carbohydrate consumption, meal by meal, around planned training sessions
  • “Fuelling for the work required”
    • low carbs before and during lighter training sessions
    • high carbs in preparation for and during rides with greater intensities
    • always refuel after training
  • The diagram above provides an example for an elite endurance cyclist
    • The red, amber, green colour coding indicates low, medium or high carbohydrate consumption
    • On day 1, the athlete aims to “train high” for a hard session
    • A lighter evening meal on day 1 prepares to “sleep low, train low” ahead of a lower intensity session on day 2
    • Carbohydrate intake rises after exercise on day 2 in anticipation of a high intensity session on day 3
    • Fuelling is moderated on the evening of day 3 as day 4 is assigned as a recovery day
    • Carbohydrate rises later on day 4 to prepare for the next block of training
  • The Pillar app aims to provide these leading edge scientific principles to amateur cyclists and other athletes

In order to put this into action, you need to know how much carbohydrate you are consuming. My assumption has been that my diet is reasonably healthy, but I have never actually measured it. So I have been experimenting with free app MyFitnessPal that can be downloaded onto your phone. This provides a simple and convenient way to track the nutritional composition of your diet, including a barcode scanner that recognises most foods. You can link it to other apps such as Training Peaks to take account of energy expended. However, neither of these tools plans nutrition ahead of training sessions. Pillar aims to fill this gap. It will be interesting to see whether this turns out to be successful.

References

Fuel for the Work Required: A Theoretical Framework for Carbohydrate Periodization and the Glycogen Threshold Hypothesis, SG Impey, MA Hearris, KM Hammond, JD Bartlett, J Louis, G Close, JP Morton, Sports Med (2018) 48:1031–1048, https://doi.org/10.1007/s40279-018-0867-7

Fuel for the work required: a practical approach to amalgamating train-low paradigms for endurance athletes, Impey SG, Hammond KM, Shepherd SO, Sharples AP, Stewart C, Limb M, Smith K, Philp A, Jeromson S, Hamilton DL, Close GL, Morton JP, Physiol Rep. 2016 May;4(10). pii: e12803. doi: 10.14814/phy2.12803

Low carbohydrate, high fat diet impairs exercise economy and negates the performance benefit from intensified training in elite race walkers, Burke LM, Ross ML, Garvican-Lewis LA, Welvaert M, Heikura IA, Forbes SG, Mirtschin JG, Cato LE, Strobel N, Sharma AP, Hawley JA.  J Physiol. 2017;595:2785–807

Low energy availability assessed by a sport-specific questionnaire and clinical interview indicative of bone health, endocrine profile and cycling performance in competitive male cyclists, BMJ Open Sport & Exercise Medicine,https://doi.org/10.1136/bmjsem-2018-000424

Machine learning for a medical study of cyclists

Screen Shot 2018-10-11 at 15.28.46

This blog provides a technical explanation of the analysis underlying the medical paper about male cyclists described previously. Part of the skill of a data scientist is to choose from the arsenal of machine learning techniques the tools that are appropriate for the problem at hand. In the study of male cyclists, I was asked to identify significant features of a medical data set. This article describes how the problem was tackled.

Data

Fifty road racing cyclists, riding at the equivalent of British Cycling 2nd category or above, were asked to complete a questionnaire, provide a blood sample and undergo a DXA scan – a low intensity X-ray used to measure bone density and body composition. I used Python to load and clean up the data, so that all the information could be represented in Pandas DataFrames. As expected this time-consuming, but essential step required careful attention and cross-checking, combined with the perseverance that is always necessary to be sure of working with a clean data set.

The questionnaire included numerical data and text relating to cycling performance, training, nutrition and medical history. As a result of interviewing each cyclist, a specialist sports endocrinologist identified a number of individuals who were at risk of low energy availability (EA), due to a mismatch between nutrition and training load.

Bone density was measured throughout the body, but the key site of interest was the lumbar spine (L1-L4). Since bone density varies with age and between males and females, it was logical to use the male, age-adjusted Z-score, expressing values in standard deviations above or below the comparable population mean.

The measured blood markers were provided in the relevant units, alongside the normal range. Since the normal range is defined to cover 95% of the population, I assumed that the population could be modelled by a gaussian distribution in order to convert each blood result into a Z-score. This aligned the scale of the blood results with the bone density measures.

Analysis

I decided to use the Orange machine learning and data visualisation toolkit for this project. It was straightforward to load the data set of 46 features for each of the 50 cyclists. The two target variables were lumbar spine Z-score (bone health) and 60 minute FTP watts per kilo (performance). The statistics confirmed the researchers’ suspicion that the lumbar spine bone density of the cyclists would be below average, partly due to the non-weight-bearing nature of the sport. Some of the readings were extremely low (verging on osteoporosis) and the question was why.

Given the relatively small size of the data set (a sample of 50), the most straightforward approach for identifying the key explanatory variables was to search for an optimal Decision Tree. Interestingly, low EA turned out to be the most important variable in explaining lumbar spine bone density, followed by prior participation in a weight-bearing sport and levels of vitamin D (which was, in most cases, below the ideal level of athletes). Since I had used all the data to generate the tree, I made use of Orange’s data sampler to confirm that these results were highly robust. This had some similarities with the Random Forest approach. Although Orange produces some simple graphical tools like the following, I use Python to generate my own versions for the final publication.


Finding a robust decision tree is one thing, but it was essential to verify whether the decision variables were statistically significant. For this, Orange provides box plots for discrete variables. For my own peace of mind, I recalculated all of the Student’s T-statistics to confirm that they were correct and significant. The charts below show an example of an Orange box plot and the final graphic used in the publication.

The Orange toolkit includes other nice data visualisation tools. I particularly liked the flexibility available to make scatter plots. This inspired the third figure in the publication, which showed the most important variable explaining performance. This chart highlights a cluster of three cyclists with low EA, whose FTP watts/kg were lower than expected, based on their high training load. I independently checked the T-statistics of the regression coefficients to identify relationships that were significant, like training load, or insignificant, like percentage body fat.

Conclusions

The Orange toolkit turned out to be extremely helpful in identifying relationships that fed directly into the conclusions of an important medical paper highlighting potential health risks and performance drivers for high level cyclists. Restricting nutrition through diet or fasted rides can lead to low energy availability, that can cause endocrine responses in the body that reduce lumbar spine bone density, resulting in vulnerability to fracture and slow recovery. This is know as Relative Energy Deficiency in Sport (RED-S). Despite the obsession of many cyclists to reduce body fat, the key variable explaining functional threshold power watts/kg was weekly training load.

References

Low energy availability assessed by a sport-specific questionnaire and clinical interview indicative of bone health, endocrine profile and cycling performance in competitive male cyclists, BMJ Open Sport & Exercise Medicine, https://doi.org/10.1136/bmjsem-2018-000424

Relative Energy Deficiency in Sport, British Association of Sports and Exercise Medicine

Synergistic interactions of steroid hormones, British Journal of Sports Medicine

Cyclists: Make No Bones About It, British Journal of Sports Medicine

Male Cyclists: bones, body composition, nutrition, performance, British Journal of Sports Medicine