Tour de France and COVID-19

A report in VeloNews on the eve of the Tour de France stated that the French government had insisted that the “two strikes and you are out” policy must be enforced by the ASO. This means that if two positive COVID-19 test arise within a team or its support staff, the team will be removed from the race. This raises the possibility of the yellow jersey rider being ejected from the race if, for example, two mechanics record positive tests. This would be particularly unjust if it turns out that a test result was a false positive. So what are the chances that this might happen?

False positives

One of the great frustrations of the reporting on COVID testing has been the lack of clarity about what type of testing is being discussed. Tests fall in to two categories. Antigen tests use a sample from a nasal or pharyngeal swab to detect patients who currently have the disease, whereas antibody tests use a blood sample to identify patients who have developed antibodies as a result of exposure to the disease in the past – more than 28 days earlier.

There are two general types of antigen test. Real time polymerase chain reaction (RT-PCR) tests looks for specific viral fragments and need to be conducted in a laboratory, typically requiring at least 24 hours for a result. Less reliable rapid tests look for proteins associated with the COVID-19 virus, producing results in as little as 15 minutes.

The UCI requires riders and staff to be tested using RT-PCR, which is a very reliable method, having both high sensitivity (ability to detect those with the disease) and high specificity (ability to clear those without the disease). The relevant question for the Tour de France is the probability of a false positive RT-PRC test. Indeed Larry Warbass recently said he thought his result was a false positive, as he had experienced no symptoms and had maintained strict self isolation during training.

The evidence indicates that the machines performing the RT-PRC test are extremely unlikely to generate a false positive, because the test needs to find significant levels of three different targets to confirm the presence of COVID-19. In FDA experiments, 100% of negatives where correctly identified – there were no false positives. However, it remains possible that, in the moving circus of the Tour de France, a sample could become contaminated before it is tested or that samples might somehow be mislabelled. A high level of responsibility falls on the shoulders of team doctors to minimise these risks, but we can never be sure that it is zero.

One in a thousand

As a thought experiment, suppose that a negative RT-PCR test is 99.9% reliable, i.e. that one COVID-free person in a thousand somehow produces a false positive result. What is the chance that a team is unjustly sent home from the Tour?

Each team has eight riders plus support staff. Although teams might want to reduce the number of staff in the team bubble, it may be necessary to have extra catering staff in order to remain self sufficient. Let us assume an average of 17 staff on each of the 21 teams and that everybody has passed the required two negative tests prior to the start of the race. Assume further that nobody contracts COVID-19 throughout the race.

It has been indicated that everyone will be tested on the two rest days. Reassuringly, the probability of two or more false positives in a single team bubble of 25 people would be 0.03% (1-0.999^(25*2)). However, the probability that every team rider receives a negative result would be only 85% (0.999^168), meaning that there would be a 15% chance that at least one rider is unjustly ejected from the race. In fact, since at total of 1,050 tests would be taken by everyone in a team bubble, the chance of at least one person receiving a false positive would be surprisingly high: 65% (1- 0.999^1050).

Perhaps the assumption of 1 in a thousand false positives was a bit alarmist. Reducing it to 1 in thousand still produces a probability of 10% that somebody would be sent home during the Tour.

Blind eyes

In some situations, draconian sanctions might deter team members or staff from reporting symptoms. One could imagine a soigneur or mechanic having to go home quietly after mysteriously spraining a wrist. However, this could create very negative press coverage if word got out that this person was infected.

Furthermore, the UCI rules place responsibility on the teams and specifically the team doctors to apply strict daily monitoring and controls to detect suspected COVID-19 cases.

Champs Elysées

While in the above scenarios no one actually contracted COVID-19, there is, of course a not inconsiderable chance that one of the 525 people in the team bubbles does actually become infected. If the virus spreads to more than one team, the whole race could become a fiasco.

But let’s keep our fingers crossed and hope Tour makes it to the Champs Elysées.

Efficient COVID testing on a hypercube

A strategy for finding people infected with SARS-CoV-2: optimizing pooled testing at low prevalence, Mutesa et al

In previous blogs, I described how mathematical modelling can help understand the spread of the COVID-19 epidemics and provide privacy-preserving contact tracing. Looking forward at how the world will have to deal with COVID-19 in the coming months, it is likely that a significant percentage of the population will need to be tested multiple times. In a recent BBC science podcast, Neil Turok, Leon Mutesa and Wilfred Ndifo describe their highly efficient method of implementing large-scale testing that takes advantage of pooling samples. This is helping African governments save millions on the cost of testing. I offer an outline of their innovative approach, which is described in more detail in a paper published on arxiv.org.

The need for large-scale testing

The roll-out of antigen testing in some countries, like the US and the UK, has been painfully slow. Some suggest that the US may need to carry out between 400,00 and 900,000 tests a day in order to get a grip on the epidemic. When antigen tests cost 30-50 US dollars (or 24-40 UK pounds), this could be very expensive. However, as long as a relatively small percentage of the population is infected, running a separate test for everyone would be extremely inefficient compared with approaches that pool samples.

Pooling offers a huge advantage, because a negative test for a pooled sample of 100 swabs, would clear 100 people with a single test. The optimal size of the pools depends on the level of incidence of the disease: larger pools can be used for lower incidence.

The concept of pooling dates back to the work of Dorfman in 1943. His method was to choose an optimal pool size and perform a test on each pooled sample. A negative result for a pool clears all the samples contained in it. Then the infected individuals are found by testing every sample in the the positive pools. Mutesa and Ndifo’s hypercube method is more efficient, because, rather than testing everyone in an infected pool, you test carefully-selected sub-pools.

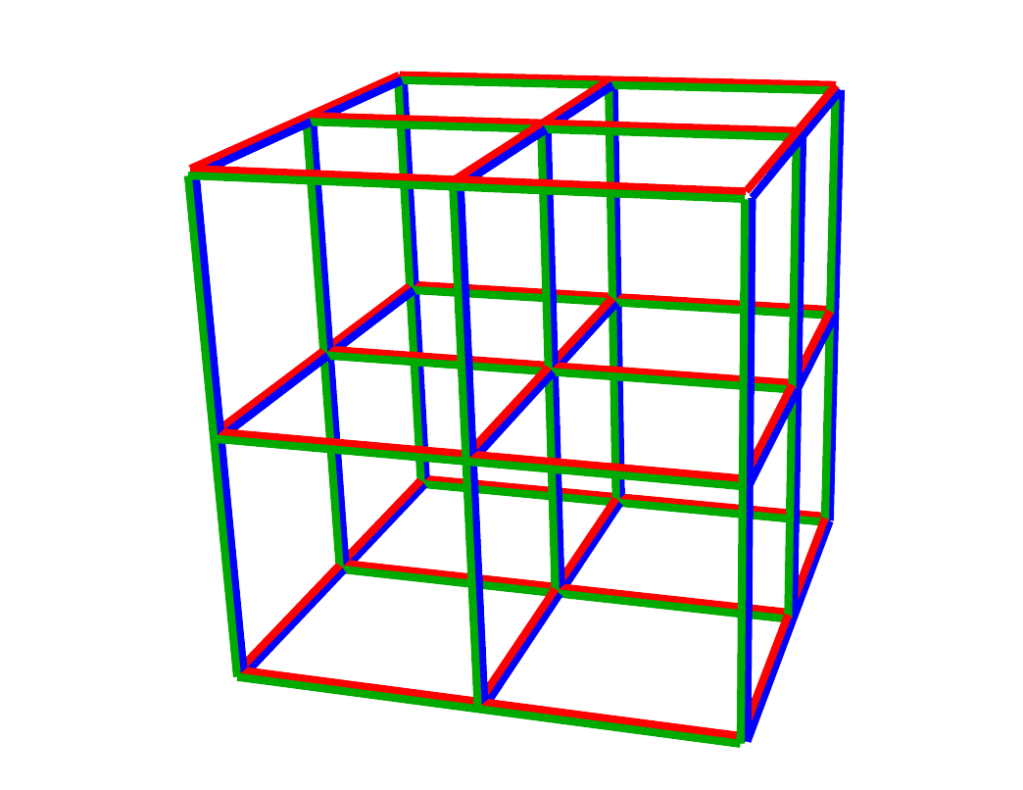
The idea is to imagine that all the samples in a pool lie on a multidimensional lattice in the form of a hypercube. It turns out that the optimal number of points in each direction is 3. Obviously it is hard to visualise high dimensions, but in 3-D, you have 27 samples arranged on a 3x3x3 grid forming a cube. The trick to identifying individual infected samples is to create sub-pools by taking slices through the lattice. In the diagram above, there are 3 red slices, 3 green and 3 blue, each containing 9 samples.

Consider, for simplicity, only one infected person out of the 27. Testing the 9 pools represented by the coloured slices will result in exactly 3 positive results, representing the intersection of the three planes passing through the infected sample. This uniquely identifies the positive individual with just 9 tests, whereas Dorfman would have set out to test all 27, finding the positive, on average after doing half of these.

Slicing a hypercube

Although you can optimise the pool size to ensure that the expected number of positives in any pool is manageable, in practice you won’t know how many infected samples are contained in any particular pool. The hypercube method deals with this by noting that a slice through a D-dimensional hypercube is itself a hypercube of dimension D-1, so the method can be applied recursively.

The other big advantage is that the approach is massively parallel, allowing positives to be identified quickly, relative to the speed of spread of the pandemic. About 3 rounds of PCR tests can be completed in a day. Algorithms that further reduce the total number of tests towards the information theoretical limit, such as binary search, require tests to be performed sequentially, which takes longer than doing more tests in parallel.

In order to make sure I really understood what is going on, I wrote some Python code to implement and validate the hypercube algorithm. In principle, it was extremely simple, but dealing with low probability edge cases, where multiple positive samples happen to fall into the same slice turned out to be a bit messy. However, in simulations, all infected samples were identified with no false positives nor false negatives. The number of tests was very much in line with the theoretical value.

Huge cost savings

My Python program estimates the cost savings of implementing the hypercube algorithm versus testing every sample individually. The bottom line is that the if the US government needed to test 900,000 people and the background level of infection is 1%, the algorithm would find all infected individuals with around 110,000 tests or 12% of the total samples. At $40 a test, this would be a cost saving of over $30million per day versus testing everyone individually. Equivalent calculations for the UK government to test 200,000 people would offer savings of around £5million pounds a day.

It is great to see leading edge science being developed in Africa. Cost conscious governments, for example in Rwanda, are implementing the strategy. Western governments lag behind, delayed by anecdotal comments from UK officials who worry that the approach is “too mathematical”, as if this is somehow a vice rather than a virtue.

References

A strategy for finding people infected with SARS-CoV-2:optimizing pooled testing at low prevalence, Mutesa et al

Privacy preserving COVID-19 tracking apps

Source: Nicky Case

As the initial global wave of COVID-19 infections is brought under control, the world is moving into a phase of extensive testing, tracking and tracing, until a vaccine can be found. The preservation of personal privacy must be paramount in these initiatives.

The UK government’s target of performing 100,000 tests a day by the end of April 2020 provided a fine example of Goodhart’s law: “When a measure becomes a target, it ceases to be a good measure”. One tragic consequence was the willingness, even encouragement, to define just about anything as a “completed test”, including the action of simply dispatching a kit by post. This has discouraged the distinguish between different types of test: antigen or antibody, nasal swab or blood test, pin-prick or venous sample, laboratory analysis or on-the-spot result.

For those who suspect they might have been exposed to COVID-19, an antibody test is the most useful. Although there has not been time to gather sufficient information to be absolutely sure, the detection of antibodies in the blood should provide immunity from infection, at least in the short term, unless the virus mutates sufficiently to bypass the immune response. Private tests are available from providers, such as Forth, where reliable results of IgG antibodies are provided by laboratory tests performed using the Abbot Architect method.

A second area where the UK government seems to be going wrong is in hiring thousands of people to carry out intrusive tracking and tracing. Not only is this hugely inefficient, it is also a massive unnecessary invasion of personal privacy. That a data leak occurred before it even started hardly inspires confidence.

Privacy Preserving Contact Tracing

A team of epidemiologist and cryptographers called DP-3T has released open source software that makes use of Bluetooth messages exchanged between mobile phones to track and trace COVID-19 infections entirely anonymously. It does not require users to surrender any personal information or location data. The approach is the basis for the technology announced jointly by Apple and Google.

The method is explained very nicely in this video 3Blue1Brown or in comic form by Nicky Case. This is a summary of how it works. Once you download a privacy preserving app onto your phone, it transmits random numbers over Bluetooth, at regular time intervals, and simultaneously listens for the random numbers of other users. Since the numbers are random, they contain no information about the you. Your phone locally maintains a list of your transmitted random numbers. It also stores locally a list of all numbers received, possibly including a timestamp and the Bluetooth signal strength, which gives some information about the proximity of the other user. Items older than, say, 14 days can be deleted from both lists.

If a person falls ill and tests positive for COVID-19 antigens, that person can voluntarily, with the permission of a healthcare professional, anonymously upload the list of transmitted random numbers to a central database. The phone app of every user periodically checks this database against its local list of received messages. If a match is detected, the app can identify the date, time and duration of contact, along with an estimate of proximity. This allows the app to advise a user to “self-isolate” for an appropriate period. This matching can all be done locally on the phone.

If set up appropriately, neither Google nor Apple nor any government body would be able to identify any particular individual. Privacy is preserved. No human trackers or tracers are required. No ankle bracelets or police guards are necessary. The system is entirely voluntary, but if sufficient users join up, say, 60% of those susceptible, it can still have a significant impact in controlling the spread of the virus. This is the correct way forward for a free and democratic society.

No drafting

In a fascinating white paper, Bert Blocken, Professor of Civil Engineering at Eindhoven University of Technology, comments on social distancing when applied to walking, running or cycling. His point is that the government recommendations to maintain a distance of 1.5 or 2 metres assume people are standing still indoors or outdoors in calm weather. However, when a person is moving, the majority of particulate droplets are swept along in a trailing slipstream.

Cyclists typically prefer to ride closely behind each other, in order to benefit from the aerodynamic drafting effect. Cycling is currently a permitted form of exercise in the UK, though only if riding alone or with members of your household. Nevertheless, there may be times when you find yourself catching up with a cyclist ahead. In this situation, you should avoid the habitual tendency to move up into the slipstream of the rider in front.

Professor Blocken’s team has performed computational fluid dynamics (CFD) simulations showing the likely spread of micro-droplets behind people moving at different speeds. As the cloud of particles, produced when someone coughs or sneezes, is swept into the slipstream, the heavier droplets, shown in red in the diagram above, fall faster. These are generally thought to be more considerably more contagious. You can see that they can land on the hands and body of the following athlete.

Based on the results, Blocken advises to keep a distance of at least four to five meters behind the leading person while walking in the slipstream, ten meters when running or cycling slowly and at least twenty metres when cycling fast.

Social Distancing v2.0

The recommendation, for overtaking other cyclists, is to start moving into a staggered position some twenty metres behind the rider in front, consistently avoiding the slipstream as you pass.

The results will be reported in a forthcoming peer-reviewed publication. But given the importance of the topic, I recommend that you take a look at the highly accessible three page white paper available here.

References

Social Distancing v2.0: During Walking, Running and Cycling
Bert Blocken, Fabio Malizia, Thijs van Druenen, Thierry Marchal

Coronavirus maths

As a growing number of people seek to educate themselves on coronavirus COVID-19, while confined to their homes, a better understanding can be gained by taking a look at how to model an epidemic.

Researchers have created highly complex models of the spread of infections. For example, BlueDot’s disease-tracking model, described in this podcast, monitors the Internet with AI language translators and evaluates the network effects of transmission based on air travel itineraries. However, a surprising amount of insight can be gained from a very simple approach called the SIR model.

SIR model

The SIR model divides the population into three classes. The susceptible class (S) includes everyone who can catch the infection. In the case of a novel virus like corona, it seems that the entire global population was initially susceptible. The infected class (I) includes all those currently infected and able to transmit the virus to susceptible people. The removed class (R) includes everyone who has recovered from the virus or, unfortunately, died. In the model, these people no longer transmit the disease nor are they susceptible. The idea is that people move from the susceptible class to the infected class to the removed class.

Although there is much focus in the media on the exponential rise of the total number of cases of coronavirus, this figure includes recoveries and deaths. In one sense this is a huge underestimate, because the figures only includes people who have taken a test and returned a positive result. As explained by Tomas Pueyo, many people do not display symptoms until around 5 days after infection and for over 90% these symptoms are mild, so there could be ten times more people infected than the official figures suggest. In another sense, the figures are a huge exaggeration, because people who have recovered are unlikely to be infectious, because their immune systems have fought off the virus.

The SIR model measures the number of infectious people. On the worldometers site these are called “active cases”. The critical insight of the SIR model, shown in the diagram above, is that the class of infected people grows if the daily number of new cases exceeds the number of closed cases.

Closed cases – removal rate

In a real epidemic, experts don’t really know how many people are infected, but they can keep track of those who have died or recovered. So it is best to start by considering the rate of transfer from infected to removed. After some digging around, it appears that the average duration of an infection is about 2 weeks. So in a steady state situation, about on person in 14 or 7% of those infected would recover every day. This percentage would be a bit less than this if the epidemic is spreading fast, because there would be more people who have recently acquired the virus, so let’s call it 6%. For the death rate, we need the number of deaths divided by the (unknown) total number of people infected. This is likely to be lower than the “case fatality rate” reported on worldometers because that divides the number of deaths only be the number of positive tests. The death rate is estimated to be 2-3%. If we add 3% to the 6% of those recovering, the removal rate (call it “a”) is estimated to be 9%.

In the absence of a cure or treatment for the virus, it is unlikely that the duration of infectiousness can be reduced. As long as hospitals are not overwhelmed, those who might otherwise have died may be saved. However, there is not much that governments or populations can do to speed up the daily rate of “closed cases”. The only levers available are those to reduce the number of “new cases” below 9%. This appeared to occur as a result of the draconian actions taken in China in the second half of February, but the sharp increase in new cases that became apparent over the weekend of 6/7 March spooked the financial markets.

New cases – infection rate

In the SIR model, the number of new infections depends on three factors: the number of infectious people, the number of susceptible people and the something called the infection rate (r), which measures the probability that an infected person passes on the virus to a susceptible person either through direct contact or indirectly, for example, by contaminating a surface, such as a door handle.

Governments can attempt to reduce the number of new infections by controlling each of the three driving factors. Clearly, hand washing and avoiding physical contact can reduce the infection rate. Similarly infected people are encouraged to isolate themselves in order to reduce the proportion of susceptible people exposed to direct or indirect contact. Guidance to UK general practitioners is to advise patients suffering from mild symptoms to stay at home and call 111, while those with serious symptoms should call 999.

When will it end?

As more people become infected, the number of susceptible people naturally falls. Until there is a vaccine, there is nothing governments can do to speed up this decline. Eventually, when enough people will have caught the current strain of the virus, so-called “herd immunity” will prevail. It is not necessary for everyone to have come into contact with the virus, rather it is sufficient for the number of susceptible people to be smaller than a critical value. Beyond this point infected people, on average, recover before they encounter a susceptible person. This is how the epidemic will finally start to die down.

When people refer to the transmission rate or reproduction rate of a virus, they mean the number of secondary infections produced by a primary infection across a susceptible population. This is equal to the number of susceptible people times the infection rate divided by the removal rate. This determines the threshold number of susceptible people below which the number of infections falls. The critical value is equal to removal rate relative to the infection rate (a/r) . When the number of susceptible people falls to this critical value, the number of infected people will reach a peak and subsequently decline. More susceptible people will still continue to be infected, but at a decreasing rate, until the infection dies out completely, by which time a significant part of the population will have been infected.

This looks very scary indeed

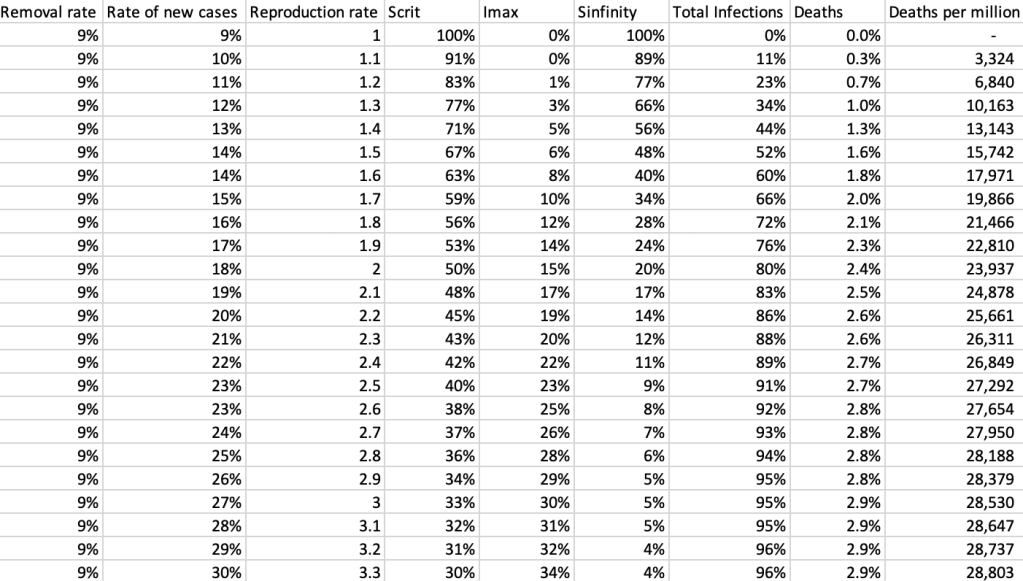
Running the figures through the SIR model produces some extremely scary predictions. At the time of writing, new cases of infection were rising at a rate of about 15%. At this rate, the virus could spread to 2/3 of the population before it dies out. If three percent of those infected die, the virus would kill 2 percent of the population. Based on results so far these would be largely elderly people or those suffering from complications, so it is extremely important that they are protected from infection. If the virus continues to run out of control, the number of deaths could run into the millions before the epidemic ends.

It is absolutely essential to reduce the infection rate and keep it low, particularly among the elderly and vulnerable groups

We should watch China carefully for new cases. If none arise, it suggests that a large proportion of the population gained immunity through infection, even though lower numbers of infections were reported. However, if the imposition of constraints temporary reduced the infection rate, leaving a large susceptible pool still vulnerable, the epidemic could re-emerge once the constraints are relaxed.

What to do?

The imposition of governments restrictions on travel and large gatherings are forcing the people to rethink their options. Where possible, office workers, university students, schoolchildren and sportsmen may find themselves congregating online in virtual environments rather than in the messy and dangerous real world.

Among cyclists, this ought to be good news for Zwift and other online platforms. Zwift seems to be particularly well-positioned, due to its strong social aspect, which allows riders to meet and race against each other in virtual races. It also has the potential to allow world tour teams to compete in virtual races.

In fact the ability to meet friends and do things together virtually would have applications across all walks of life. Sports fans need something between the stadium and the television. Businesses need a medium that fills the gap between a physical office and a conference call. Schools and universities require better ways to ensure that students can learn, while classrooms and lecture theatres are closed. These innovations may turn out to be attractive long after the coronavirus scare has subsided.

While the prospect of going to the pub or a crowded nightclub loses its appeal, cycling offers the average person a very attractive alternative way to meet friends while avoiding close proximity with large groups of people. As the weather improves, the chance to enjoying some exercise in the fresh air looks ever more enticing.

End notes

SIR model based on: Mathematical Biology J.D. Murray, chapter 19