Chemical composition of a bicycle

A high-performance bicycle relies of a mix of advanced polymer science an metallurgy. Carbon only makes up about the half the mass of a carbon-framed bike. The moving components include iron, aluminium and specialist alloys. The frame is held together with epoxy resins and the tyres include a range of compounds to reduce rolling resistance, while maintaining grip. I wondered, what is the chemical composition of my bicycle? Where do these chemicals come from?

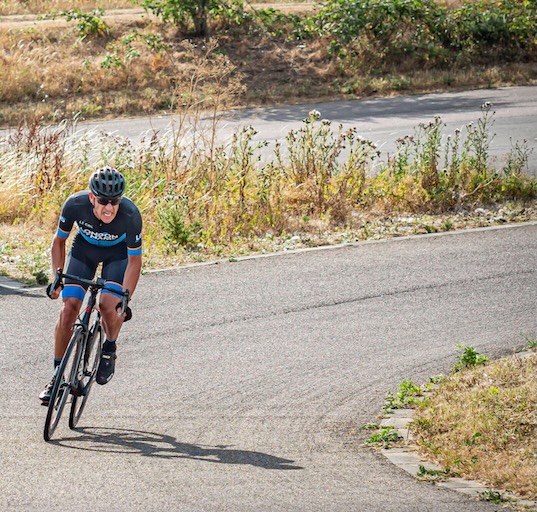
Canyon frameset and deep-section wheels

The primary materials of the frame and rims are carbon fibre and epoxy resin. High-end frames and rims use “pre-preg” carbon filaments held together by a thermosetting resin matrix. Carbon fibre is roughly 95% elemental carbon. It is created by heating precursor fibres until only carbon remains in a hexagonal crystalline structure. Epoxy resin is polymer typically derived from carbon, hydrogen and oxygen. It provides the compressive strength that keeps the carbon fibres in shape.

Estimated Mass: ~2.8 kg (Frame, Fork, Rims).

Elemental makeup: ~80% Carbon, ~12% Oxygen, ~7% Hydrogen, ~1% Nitrogen.

Shimano Ultegra drivetrain

The drivetrain is made out of aluminium alloys, stainless steel and small amounts of titanium/chrome. The cranks and hubs require high-strength aluminium alloys that include zinc and magnesium to prevent fatigue. The cassette and chain are mostly chromium-steel. The chain requires high tensile strength and wear resistance, achieved through iron alloyed with carbon and chromium. Bearings are steel (iron/chromium) or occasionally ceramic (silicon nitride).

Estimated Mass: ~2.6 kg.

Elemental makeup: ~65% Iron, ~30% Aluminium, ~3% Chromium, ~2% Zinc/Magnesium/Others.

Continental GP5000 Tyres

Tyres are made from synthetic/natural rubber, silica and carbon black, a reinforcing agent. The GP5000 is famous for its “Black Chili” compound. Unlike older tyres that relied heavily on carbon black, modern high-performance tyres use a high percentage of silica to reduce rolling resistance while maintaining grip. The casing is usually nylon (polyamide), consisting of carbon, nitrogen, oxygen and hydrogen. The bead is often Kevlar (aramid), which is another nitrogen-rich polymer.

Estimated Mass: ~0.5 kg (for the pair).

Elemental makeup: ~60% Carbon, ~20% Silicon, ~10% Oxygen, ~5% Sulphur (used in vulcanization), ~5% Hydrogen/Nitrogen

Total Elemental Breakdown (By Mass)

This table estimates the elemental distribution for a complete 8,000g (8kg) bike. These figures are calculated based on the average weight of the components listed above.

ElementEstimated Mass (g)% of TotalPrimary Source
Carbon3,840g48.0%Frame, wheels, tyres, resins, saddle
Iron1,760g22.0%Chain, cassette, spokes, bearings, bolts
Aluminium1,440g18.0%Crankset, hubs, stem, bars, calipers
Oxygen400g5.0%Epoxy resins, rubber compounds, paint
Hydrogen240g3.0%Polymer chains in resins and plastics
Silicon120g1.5%Tyre compound (Silica), lubricants
Chromium80g1.0%Stainless steel hardening (Drivetrain)
Nitrogen40g0.5%Nylon tyre casing, Kevlar beads
Sulphur40g0.5%Vulcanising agent in tyres and tubes
Others (Zn, Mg, Ti, Cu)40g0.5%Aluminium alloying and specialty bolts
Total8,000g100%

Where do these elements come from?

A fascinating paper by Craig Tindale, “The Return of Matter”, provides a sobering perspective on the dependency of manufacturers on the dirty and energy-intensive business of refining, purifying and separating the elements required for modern engineering and technology. While a Canyon bikes are designed in Germany and its Shimano components are engineered in Japan, the material reality of the bike is heavily dependent on Chinese industrial processing to turn the raw ore into high-purity metals and polymers.

Here is how this bike’s elemental components are tied to Chinese supply chains:

1. Carbon (48.0% of Mass)

Component: Frame, Wheels, Resins.

Dependency: High.

While the article focuses on metals, it notes that China has spent decades building the “processing sovereignty” required for advanced materials. High-modulus carbon fibre and the epoxy resins that bind them are part of a complex polymer supply chain where China acts as a global gatekeeper. Even if the precursor chemicals are sourced elsewhere, the massive scale of carbon fibre “midstream” production is increasingly concentrated in China.

2. Iron/Steel (22.0% of Mass)

Component: Chain, Cassette, Spokes, Bearings.

Dependency: Total.

Tindale describes an “Iron Ore Stranglehold”. Even though Western majors like BHP and Rio Tinto mine the ore, it is shipped as concentrate directly to Chinese smelters. The steel in your Ultegra cassette is likely refined in a Chinese furnace that sets the global “tempo of Western inflation” and availability.

3. Aluminium (18.0% of Mass)

Component: Crankset, Hubs, Cockpit.

Dependency: Extreme (60% share).

China controls approximately 60% of global aluminium smelting. Furthermore, high-performance aluminium (like the 7000-series in your cranks) requires magnesium for hardening. China controls 90–95% of global magnesium smelting. Without Chinese magnesium, your bike’s aluminium components would lack the fatigue resistance necessary for racing.

4. Silicon (1.5% of Mass)

Component: Tires (Silica), Lubricants.

Dependency: Dominant (95% share).

The refining of silicon is a massive Chinese monopoly; they control 95% of the world’s polysilicon capacity. While your tyres use silica , the high-purity chemical processing required for the “Black Chili” compound sits firmly behind what Tindale calls China’s “lattice of chemical plants”.

5. Chromium & Others (Mg, Ti, Cu) (2.0% of Mass)

Component: Stainless steel, Alloying, Bolts.

Dependency: Structural (The “Derivative Mineral Trap”).

Titanium is used in high-end bolts and derailleur parts. China and Russia control 75% of global titanium sponge capacity. The US has only one domestic plant, leaving bike manufacturers with almost no non-adversarial choice for titanium. Chromium and other alloy ingredients are often recovered as “hitchhikers” during the smelting of host metals. Since China dominates base metal smelting (e.g., 50% of copper), it essentially “inherits” the critical by-products needed to harden your bike’s drivetrain.

Summary: The “Bicycle Trap”

You might “own” the bike, while Canyon and Shimano might “own” the design, but the kinetic power—the ability to actually build the machine—belongs to whoever owns the refineries. If China were to tighten export controls, as it has recently done for antimony (ammunition) and tungsten (munitions), the production of high-performance bikes would likely experience a “forced regression in engineering capabilities”, where manufacturers would have to substitute inferior, heavier materials for the refined ones they can no longer access.

Human Blood Protein Atlas

A recent report in Science announced the publication of a new human blood protein atlas, describing the disease signatures of thousands of proteins circulating in the blood. Minimally invasive protein profiling marks a step forward in the personalisation of medicine. Some interesting statistical and machine learning techniques were employed.

Blood Protein Study

The researchers’ methods included a technique called proximity extension assay (PEA), which makes use of highly specific probes of DNA strands to detect minute concentrations of proteins in the blood plasma. Amplification with PCR (Polymerase Chain Reactions) allowed 5,416 proteins to be evaluated.

A longitudinal dataset showed dramatic changes as children passed through adolescence to adulthood. The central part of the study was a cross-sectional analysis, where age, sex and BMI were identified as important explanatory factors. The signatures of 59 clinically relevant diseases, in seven classes, can be viewed interactively in The Human Protein Atlas.

Into the secretome

Rather than the hideaway of a reclusive cockney, the secretome refers to the ensemble of secreted proteins. From a data science perspective, the challenge was how to find the signatures of a wide range of diseases, based on the differential abundance of over 5,400 proteins. This was complicated by the fact that many proteins elevated by a particular disease were also found to be elevated in other diseases.

“To investigate the distinct and shared proteomics signatures across diseases, we performed differential abundance analyses. Several groups were used as controls, including healthy samples, a disease background consisting of all other diseases, and samples from the same disease class.”

From The Human Protein Atlas

The differential abundance of proteins was evaluated using normalised protein expression units (NPX). The volcano chart above plots the p-values against the multiplicative (fold) change in NPX, both on log scales. The red values on the right were unusually high and the blue values on the left was exceptionally low.

The researchers used a logistic LASSO approach to identify the importance of proteins in providing a signature of each disease against its cohort. In the case of HIV above, CRTAM was the most significant explanatory factor, even though CD6 had the most extreme p-value.

How does logistic LASSO work?

A logistic model is trained on target values of one or zero, in this case representing the presence or absence of a disease. Least absolute shrinkage and selection operator (LASSO) is a version of linear regression that selects the most relevant explanatory variables using L1 regularisation. Adding the sum of the absolute values of the regression coefficients to the objective function forces the contribution of irrelevant variables towards zero as the hyper-parameter, λ, is increased. This property was particularly useful for the disease signature problem, where there were thousands of potential explanatory proteins.

The tricky aspect of LASSO is tuning the hyper-parameter, λ. You want it to be high enough to eliminate irrelevant variables, but not so high that it discounts the useful explanatory features. In the protein study, this was addressed using cross-validation: randomly splitting the data into 70:30 training and test sets, then rerunning the regression for a range of λ values. The quality of a model can be assessed in terms of both its accuracy and its required number of inputs, using criteria such as the Akaike information criterion or Bayesian information criterion, which favour parsimony. Repeating the randomisation 100 times, the researchers could home in on an optimal value of λ. The regression coefficients of the resulting model could then be used to rank the importance of the relevant proteins, as shown in the right hand side of the panel above.

Personalised health

The potential for a cheap, annual blood test to screen the whole population is immense. Proteomics adds to the arsenal of resources available to help people stay healthy. Early indications of diseases like cancer can be critical in initiating treatment. There is plenty of room to broaden the scope beyond the current 59 diseases, to include rarer conditions, such as Motor Neurone Disease, which has impacted some top sportsmen. It would be extremely helpful to find proteins related to the apparent epidemic of mental health issues, which are hard to define and lack objective, quantitative diagnostic criteria.

PEAQ Performance

If you are a cyclist, athlete, dancer or exerciser struggling to reach your full potential, your might have a mismatch between your training and what you are eating. Persistently running an energy deficit can have an adverse impact on your health and performance, sometimes leading to a condition called Relative Energy Deficiency in Sport (REDs). Optimal training adaptations and peak achievements rely on consistently fuelling for the work required.

I have created an app that generates a score based on a short Personal Energy Availability Questionnaire (PEAQ) designed to identify people at risk.

Personal Energy Availability Questionnaire (PEAQ)

The PEAQ is based on research published in BMJ Open Sport & Exercise Medicine, exploring the relationship between a REDs score derived from the questionnaire and quantified clinical consequences of low energy availability. A similar approach has been used in other research.

The app automates the scoring process and generates a free downloadable report that includes graphics and an interpretation of your result. It takes a few minutes to fill in your answers and the process is anonymous.

The report breaks down the overall score into three health categories. Physical health is based on body mass index (BMI) and injuries. Physiological factors include hormones, sleep and nutrition. Psychological wellbeing relates to habits and anxiety.

Relative energy deficiency

REDs is not confined to top athletes. It can occur in men and women of any age, at all levels of performance, across a spectrum of activities, including sports, exercise and dance.

Relative energy deficits can result from deliberate under-fuelling, particularly in activities where low body weight confers an aesthetic or performance advantage (dance, cycling, climbing, running etc.). Relative energy deficits can also arise, sometimes unintentionally, as a result of stepping up one’s training load without a corresponding increase in energy intake.

Health and performance risks

For evolutionary reasons, your body prioritises movement in the allocation of its energy budget. Energy availability is a measure of the amount of energy left over for day-to-day physiological processes: breathing, digestion, repair, brain function etc.. In an energy deficit, your body switches off inessential processes, such as reproduction. Poor bone health is one of the consequences of a reduction in sex steroid hormones. Other effects of low energy availability include fatigue, disrupted sleep and digestive problems.

For active people, low energy availability reduces your ability to perform high quality training/exercise and depletes your body’s ability to deliver the desired positive adaptations, such as muscle strength and endurance capacity.

Take a PEAQ

Please take advantage of the PEAQ. If you have worries or concerns about your results, Dr Nicky Keay offers personalised health advisory appointments. You can find valuable resources at BASEM.

Technical points

I built this educational health app in Python. It is hosted on the Streamlit Community Cloud. The code is on my GitHub page.

References

Mountjoy M, Ackerman KE, Bailey DM et al 2023 International Olympic Committee’s (IOC) consensus statement on Relative Energy Deficiency in Sport (REDs) British Journal of Sports Medicine 2023;57:1073-1098
Keay N Hormones, Health and Human Potential: A guide to understanding your hormones to optimise your health and performance, Sequoia books 2022
Keay N, Francis G, AusDancersOverseas Indicators and correlates of low energy availability in male and female dancers. BMJ Open in Sports and Exercise Medicine 2020
Nicolas J, Grafenuer S. Investigating pre-professional dancer health status and preventative health knowledge Front. Nutr. Sec. Sport and Exercise Nutrition. 2023 (10)
Keay N, Francis G. Longitudinal investigation of the range of adaptive responses of the female hormone network in pre- professional dancers in training March 2025 ResearchGate DOI: 10.13140/RG.2.2.30046.34880
Keay N. Current views on relative energy deficiency in sport (REDs). Focus Issue 6: Eating disorders. Cutting Edge Psychiatry in Practice CEPiP. 2024.1.98-102
Assessment of Relative Energy Deficiency in Sport, Malnutrition Prevalence in Female Endurance Runners by Energy Availability Questionnaire, Bioelectrical Impedance Analysis and Relationship with Ovulation status. Clinical Nutrition Open Science 2025S.
Sharp S, Keay N, Slee A. Body composition, malnutrition, and ovulation status as RED-S risk assessors in female endurance athletes, Clinical Nutrition ESPEN 2023, 58 :720-721
Keay N, Craghill E, Francis G Female Football Specific Energy Availability Questionnaire and Menstrual Cycle Hormone Monitoring. Sports Injr Med 2022; 6: 177
Nicola Keay, Martin Lanfear, Gavin Francis. Clinical application of monitoring indicators of female dancer health, including application of artificial intelligence in female hormone networks. Internal Journal of Sports Medicine and Rehabilitation, 2022; 5:24.
Nicola Keay, Martin Lanfear, Gavin Francis. Clinical application of interactive monitoring of indicators of health in professional dancers J Forensic Biomech, 2022, 12 (5) No:1000380
Keay, Francis, Hind Low energy availability assessed by a sport-specific questionnaire and clinical interview indicative of bone health, endocrine profile and cycling performance in competitive male cyclists BMJ Open Sports and Exercise Medicine 2018
Keay, Francis, Hind Clinical evaluation of education relating to nutrition and skeletal loading in competitive male road cyclists at risk of relative energy deficiency in sports (RED-S): 6-month randomised controlled trial BMJ Open Sports and Exercise Medicine 2019
Keay, Francis, Hind Bone health risk assessment in a clinical setting: an evaluation of a new screening tool for active populations MOJSports Medicine 2022;5(3):84-88. doi: 10.15406/mojsm.2022.05.00125″

How many heartbeats?

AI-generated by Picsart

The fascinating work of Geoffrey West explores the idea of universal scaling laws. He describes how the lifetimes of organisms tend to increase with size: elephants live longer than mice. On the other hand, average heart rate tends to decrease with size. It turns out that these two factors balance each other in such as way that over their lifetimes, elephants have roughly the same number of heartbeats as mice and all other animals: about 1.5 billion.

Less active people might be tempted to suggest that indulging in exercise reduces our lifetimes, because we use up our allocation of heartbeats more quickly. However, exercisers tend to have a lower resting heart rate than their sedentary peers. So if we really had a fixed allocation of heartbeats, would we be better off exercising or not?

Power laws

To get a sense of how things change with scale, consider doubling the size of an object. Its surface area goes up 4 times (2 to the power of 2), while its volume and its mass rise 8 times (2 to the power of 3). Since an animal loses heat through its skin whereas its ability to generate heat depends on its muscle mass, larger animals are better able to survive a cold winter. This fact led some scientists to suspect that metabolism should be related to mass raised to the power of 2/3. However, empirical work by Max Klieber in the 1930s found a power exponent of 3/4 across a wide range of body sizes.

Geoffrey West went on to explain the common occurrence of the 1/4 factor in many power laws associating physiological characteristics with the size of biological systems. His work suggests that this is because, as they evolved, organisms have been subject to the constraints of living in a 3-dimensional world. The factor, 4, drops out of the analysis, being one more than the number of dimensions.

Two important characteristics are lifetime, which tends to increase in relation to mass raised to the power of 1/4, and heart rate, which is associated with mass raised to the power of -1/4. If you multiply the two together to obtain the total number of heartbeats, the 1/4 and the -1/4 cancel each other out, leaving you with a constant of around 1.5 billion. 

Human heart beats

According to the NHS, the normal adult heart rate while resting is 60 to 100 bpm, but fitter people have lower heart rates, with athletes having rates of 40 to 60 bpm. Suppose we compare Lazy Larry, whose resting heart rate is 70bpm, with Sporty Steve, who has the same body mass, but has a resting heart rate of 50bpm.

Let’s assume that as Larry eats, drinks coffee and moves around, his average heart rate across the day is 80bpm. Steve carries out the same activities, but he also follows a weekly training plan of that involves periods of elevated heart rates. During exercise Steve’s heart beats at 140bpm for an average of one hour a day, but the rest time it averages 60bpm.

If Larry expects to live until he is 80, he would have 80*60*24*365*80 or 3.36 billion heart beats. This is higher than West’s figure of 1.5 billion, but before the advent of modern hygiene and medicine, it would not be unusual for humans to die by the age of 40.

Exercise is good for you

The key message is that, accounting for exercise, Steve’s average daily heart rate is (140*1+60*23)/24 or 63bpm. The benefits of having a lower heart rate than Larry easily offset the effects of one hour of daily vigorous exercise.

Although it is a rather silly exercise, one could ask how long Steve would live if he expected the same number of heartbeats as Larry. The answer is 80/63 times longer or 101 years. So if mortality were determined only by the capacity of the heart to beat a certain number of times, taking exercise could add 21 years to a lifetime. Before entirely dismissing that figure, note that NHS data show that ischaemic heart disease remains one of the leading causes of death in the UK. Cardiac health is a very important aspect of overall health.

Obviously many other factors affect longevity, for example those taking exercise tend to be more aware of their health and are less likely to suffer from obesity, smoke, consume excessive alcohol or eat ultra-processed foods.

A study of 4,082 Commonwealth Games medallists showed that male athletes gained between 4.5 and 5.3 extra years of life and female athletes 3.9. Although cycling was the only sport that wasn’t associated with longer lives, safety has improved and casualty rates have declined over the years.

Exercise, good nutrition and sufficient sleep are crucial for health and longevity. There’s no point in waiting until you are 60 and taking elixirs and magic potions. The earlier in life you adopt good habits, the longer you are likely to live.

Fuelling your rides on Strava

As we move into our 40s, 50s and beyond, we may become aware of changes in our bodies. Performance peaks level off or start to decline. Even if you don’t feel old, it becomes harder to keep up with younger sprinters. It takes longer to recover from a hard ride, injury or illness.

Muscle, Fat and Bone

The cause of these age-related changes is a decline in the production of specific hormones. Growth hormone falls insidiously from the time we reach adult height. From the age of 50, testosterone levels drop slightly in men, while oestradiol levels fall dramatically as women reach menopause. The key thing to note about growth hormone and testosterone is that they are anabolic agents, i.e. they build muscle. As they decline, there is a tendency to lose muscle and to increase fat deposition. Sex steroids also play a pivotal role in bone formation.

Protein, Carbohydrates and Vitamin D

Fortunately there are measures we can take to counter the effects of declining hormones. Nutrition plays an important role. Understanding the physiological effects of hormonal changes makes it easier to recognise beneficial adaptations in your diet.

Protein provides the building blocks required for muscle. Taking an adequate level of protein, spread out through the day, is beneficial.

Carbohydrates are the key fuel for moderate to high intensity. Fasted training is not advisable. The body’s shock reaction to underfuelled training is to deposit fat.

The UK government advises everyone to take vitamin D supplements, especially over the winter. In addition to supporting bone health, studies have shown improved immunity and muscle recovery.

Nutrition as you get older

Nutrition, Exercise and Recovery

When combined with adequate nutrition, exercise, particularly strength training, stimulates the production of growth hormone and testosterone. It is important to ensure adequate recovery and to follow a regular routine of going to be early, because these hormones are produced while you are asleep.

Everybody is unique, so you need to work out what works best for you. For further insights on this topic, Dr Nicky Keay has written a book full of top tips, called Hormones Health and Human Potential.

Critical Power Model – energy and waste

The critical power model is one of the most useful tools for optimising race performance, but why does it work? The answer lies in the connection between the depletion of energy reserves and the accumulation of waste products.

Variation of W’ Balance over a race

A useful overview of the critical power model can be found in a paper by Clarke and Skiba. It applies well to cycling, where power can be measured directly, and to other sports were velocity can play the role of power. Critical power (CP) is the maximum power that an athlete can sustain for a long time without suffering fatigue. This measure of performance is closely related to other threshold values, including lactate threshold, gas exchange threshold, V̇O2max and functional threshold power (FTP). An advantage of CP is that it is a directly related to performance and can be measured outside a laboratory.

The model is based on empirical observations of how long athletes can sustain levels of power, P, in excess of their personal CP. The time to exhaustion tends to be inversely proportional to the extent that P exceeds CP. This can be described by a simple formula, where excess power multiplied by time to exhaustion, t, is a constant, known as W’ (read as “W-prime”) or anaerobic power capacity.

(P-CP)t=W’

Physics tells us that power multiplied by time is work (or energy). So the model suggests that there is a fixed reserve of energy that is available for use when we exceed our CP. For a typical athlete, this reserve is in the order of 20 to 30 kilojoules.

Knowing your personal CP and W’ is incredibly useful

Suppose you have a CP of 250W and a W’ of 21.6kJ. You are hoping to complete a 10 mile TT in 24 minutes. This means you can afford to deplete your W’ by 0.9kJ per minute, which equates to 900J in 60 seconds or a rate of 15W. Therefore your target power should be 15W above CP, i.e. 265W. By holding that power your W’ balance would slowly fall to zero over 24 minutes.
Theoretically, you could burn through your entire W’ by sprinting at 1250W for 21.6 seconds.

Replenishing W’

While it may be possible to maintain constant power on a flat TT or on a steady climb, most race situations involve continual changes of speed. A second aspect of the critical power model is that W’ is slowly replenished as soon as your power drops below CP. The rate of replenishment varies between individuals, but it has a half-time of the order of 3.5 minutes, on gentle recovery.

This means that in a race situation, W’ can recover after an initial drop. By hiding in the peloton and drafting behind other riders, your W’ can accumulate sufficiently to mount a blistering attack, of precisely known power and duration. The chart above, generated in Golden Cheetah, shows the variation of my W’ balance during a criterium race, where I aimed to hit zero in the final sprint. You can even download an app onto your Garmin headset that measures W’ in real time. It is great for criterium racing, but becomes less accurate in longer races if you fail to take on fuel at the recommended rate.

Physiology

Although I am completely convinced that the critical power model works very well in race situations, I have always had a problem with the idea that W’ is some kind of magical energy reserve that only becomes available when my power exceeds CP. Is there a special biological label that says this glycogen is reserved only for use of when power exceeds CP?

One possible answer is that energy is produced largely by the aerobic system up to CP, but above that level, the anaerobic system has to kick in to produce additional power, hence the name anaerobic work capacity. That sounds reasonable, but the aerobic system burns a mix of two fuels, fat and glucose, while the anaerobic system burns only glucose. The glucose is derived from carbohydrates, stored in the liver and muscles in the form of glycogen. But it is all the same glucose, whether it is used aerobically or anaerobically. The critical power model seems to imply that there is a special reserve of glucose that is held back for anaerobic use. How can this be?

The really significant difference between the two energy systems is that the byproducts of aerobic metabolism are water and exhaled CO2, whereas anaerobic glycolysis produces lactic acid, which dissociates into H+ ions and lactate. Note that two H+ ions are produced from every glucose molecule. The lactate can be used as a fuel, but the accumulation of H+ ions presents a problem, by reducing the pH in the cells and making the blood more acidic. It is the H+ ions rather than the lactate that causes the burning sensation in the muscles.

The body is well equipped to deal with a drop in pH in the blood, in order to prevent the acidity from causing essential proteins to denature. Homeostasis is maintained by buffering agents, such as zwitterions, that mop up the H+ ions. However, if you keep producing more H+ ions by furiously burning glucose anaerobically, the cell environment become increasing hostile, with decreasing levels of intramuscular phosphocreatine and rising inorganic phosphate. The muscles eventually shut down because they simply can’t absorb the oxygen required to maintain the flux of ATP. There is also a theory that a “central governor” in the brain forces you to stop before too much damage ensues.

You don’t “run out of energy”; your muscles drown in their own waste products

It is acknowledged that the magnitude of the W′ might also be attributed to the accumulation of fatigue-related metabolites, such as H+ and Pi and extracellular K+.

Jones et al

If you reach the point of exhaustion due to an accumulation of deleterious waste products in the muscles, why do we talk about running out of energy? And what does this have to do with W’?

Firstly note that CP represents the maximum rate of aerobic exertion, at which the body is able to maintain steady state. Oxygen, inhaled by the lungs, is transported to the muscles and the CO2 byproduct is exhaled. Note that the CO2 causes some acidity in the blood, but this is comfortably managed by the buffering agents.

The connection between H+ ions and energy is evident in the following simple chemical formula for anaerobic glycolysis. Each glucose molecule produces two lactate ions and two H+ ions, plus energy.

C6H12O6 → 2 CH3COCO2 + 2 H+ + Energy

This means that the number of H+ ions is directly proportional to energy. A W’ of 21.6kJ equates to a precise number of excess H+ ions being produced aerobically. If you maintain power above CP, the H+ ions accumulate, until the muscles stop working.

If you reduce power below CP, you do not accumulate a magic store of additional energy stores. What really happens is that your buffering systems slowly reduce the accumulated H+ ions and other waste products. This means you are able to accommodate addition H+ ions next time you exceed CP and the number of H+ ions equates to the generation a specific amount of energy that can be conveniently labeled W’.

Conclusion

W’ or anaerobic work capacity acts as a convenient, physically meaningful and measurable proxy for the total accumulated H+ ions and other waste products that your muscles can accommodate before exhaustion is reached. When racing, as in life, is always a good idea to save energy and reduce waste.

References

Overview : Rationale and resources for teaching the mathematical modeling of athletic training and performance, David C. Clarke and Philip F. Skiba

Detailed analysis: Critical Power: Implications for Determination of V˙O2max and Exercise Tolerance, Andrew Jones et al

Implementation: W’bal its implementation and optimisation, Mark Liversedge

Supercompensating with Strava

Supercompensation sounds like a reference to an investment banker’s salary, but in fact it describes the body’s ability to adapt positively to a training stimulus. The idea is to attain a higher level of fitness, following a training session, than you had before. In fact, that is generally the point of training. This concept is closely linked to Strava’s Fitness and Freshness charts.

The development of athletic performance requires a delicate balance between an adequate stimulus that drives adaptation and the provision of sufficient recovery time to allow these adaptations to take place

Endocrinology of Physical Activity in Sport, Third Edition

Much has been written about supercompensation, but, as the quotation above highlights, improving your own personal performance depends on
– applying the optimal amount of training stimulus and
– allowing the correct amount of recovery time.

How does supercompensation work?

A hard training session puts your body under stress. An athlete who is perspiring profusely and complaining of aching limbs experiences similar symptoms to a patient with a severe fever. The stress induced by both of these situations is picked up in the brain by the hypothalamus, which triggers a range of hormonal responses, putting the body into recovery mode.

Physical exercise challenges the muscular-skeletal, cardiovascular and neurological systems. The hormonal response elicits a range of actions around the body, including muscle repair, replenishment of glycogen stores, increase in mitochondria and reinforcement of neural pathways. These processes do not begin until activity has ceased, so, in fact, you become fitter during the rest and recovering phase, rather than while you are actually exercising.

The recovery processes take time and energy. In addition to fuelling before and during exercise, it is important to refuel after a hard training session, particularly during the first 20 minutes.

Optimal training stimulus

Training stimulus is a function of duration and intensity. Strava measures this as Training Load, which shows up as Training Impulse on your Fitness & Freshness chart. This is similar to other commonly used measures. You should also have in mind what aspect of fitness you need to develop for your target events (endurance, power, sprint etc.).

I recently rode over 200km from London to Brighton and back, which Strava calculated as a Training Load of 400. Unfortunately this probably did not make me much fitter, because it left me greatly fatigued. During the next two days that I spent recovering, my body probably just about reattained its previous base line level of fitness and failed to achieve supercompensation. It was a great ride, but it was also an example of excessive training stimulus .

On the other hand, going for a gentle ride without any strong effort is unlikely to put the body under enough stress to give rise to the desired hormonal response. Any supercompensation is likely to be minimal. Some people might call this “junk training”, because higher duration or intensity is needed, in order to become fitter.

So what is the optimal training stimulus you should aim for? A simple answer is to check your Strava Fitness & Freshness page and set a target Training Load equal to about 1.3 to 1.5 times your current Fitness (quite a hard session). This all links back to how to ramp up your fitness.

The right recovery time

As mentioned above, you get fitter while you are recovering. Ideally your next training session should be timed to match the peak of supercompensation. The colour coding of the chart provides a traffic light system. If you train again too early, your body will not have time to recover. But if you leave it too long, you miss the opportunity. As a general rule, it is sensible to follow a hard training day with an easier day. It is also very important to take one full rest day per week, where activity is limited to nothing more than a short walk or some stretching. When is comes to recovery, remember that sleep is “Chief nourisher in life’s feast”.

Functional overreaching (FOR)

Good periodisation of training stimulus and recovery results in beneficial performance adaptation, known as functional overreaching. This stimulates anabolic (muscle building) hormones, such as IGF1 and testosterone, while stress hormones, like cortisol remain low. The athlete sees a steady improvement in performance.

Nonfunctional overreaching (NFOR)

Nonfunctional overreaching occurs when an athlete is too eager to train again. Without sufficient recovery, the body is only just back to base line when it is hit with another bout of exercise. No time is allowed for the anabolic response. This is throwing away the potential benefits of supercompensation and leads to a stagnation of performance.

Overtraining syndrome (OTS)

Overtraining syndrome occurs when the next training session begins before the body has fully recovered from the last one. This can be a problem for athletes juggling a high number of training hours with a full-time job. When the endocrine system is put under this level of stress, cortisol, prolactin and creatine kinase tend to rise, while sex steroids become depressed. This results in an accumulation of fatigue and a progressive deterioration of performance.

When were you last in a fully recovered state?

You can tell which of these situations applies to you, by asking how long has it been since you were in a fully recovered state? If it is days, you should be able to get fitter. If it is weeks, you may be in a state of nonfunctional overreaching. If you have not been in a fully recovered state for months, you have overtraining syndrome. The period taken to recover to a healthy state often has the same timescale.

How do I know if I am in a fully recovered state?

Various apps use heart rate variability (HRV) as an indicator of recovery. Alternatively, you can activate the sliders for Fatigue and Form on your Strava Fitness & Freshness page and look for positive Form. This is when Fitness is greater than Fatigue. My chart below shows a sustained period of high Fatigue and negative Form in April, suggesting that some of the training in that heavy block may have been somewhat counterproductive, but at least I took a rest week in early May.

Super compensation

Supercompensation is the underlying mechanism of periodised training. It works on a number of timescales from the days in a weekly plan, to the weeks in a monthly plan and up to the months in the season’s plan. I hope that this read has provided you with super compensation.

Related posts

Science for dance performance

Professional dancers are like elite athletes

This web site is about using science to improve performance. Although my focus has generally been on sport, science can also help artistic performance. Professional dancers face many of the same challenges as elite athletes, but a cultural divide separates the two communities. A recent paper helps to bridge this gap, by showing that scientific advances in managing relative energy deficiency in sport (RED-S) may be of great benefit in the dance world.

Dance and sport

Professional dancers spend many hours a day training in order to deliver top level performances in high pressure situations. On stage, they are quite literally under the spotlight. They also start young, developing bodies that are able to meet the high level of technical demands required to reach the top. In spite of the similarities with the lives of those in elite sport, artistic performance is viewed differently from athletic performance. A prima ballerina would not consider herself an athlete any more than a sprinter would consider herself a dancer. Strictly Ballroom is dance, whereas figure skating is sport. This separations stretches from the individual participants up to the level of governing bodies.

Athletes in many sports adapt their body composition to gain an advantage, often seeking to achieve “race weight” ahead of competition. In many ways, the situation is more extreme for dancers, particularly those pursuing classic forms such as ballet, who aim for a body shape that meets aesthetic ideals, while maintaining the strength and flexibility to perform.

Relative energy deficiency in dance

In the paper, dancers were invited to complete an online survey that had been based on previous studies of athletes who were potentially at risk of low energy availability, specifically RED-S. Responses included anthropomorphic data, training and performance hours, injuries and illness, indicators of hormone status and attitudes to eating and weight control.

A RED-S risk score was derived from each dancer’s responses. Of the 247 participants, 57% of females and 29% of males had negative scores, consistent with low energy availability.

Psychological factors proved to be important. Many dancers felt anxious about missing class or rehearsals, in a similar way to athletes who suffer from exercise addiction. These dancers also tended to be more obsessive about controlling their weight and what they eat. Most considered the chances of gaining a leading role to be higher if they lost weight. These kinds of attitudes were observed in an earlier study of male cyclists.

Among the female dancers, some interesting correlations showed up between these mental attitudes and both physical and physiological factors. The more obsessive individuals tended to have a lower body mass index (BMI) particularly when calculated using their lowest weight for their current height. They also tended to have experienced various forms of menstrual disfunction, indicating a disruption to normal hormonal function that has been observed in female athletes in low energy availability.

The large majority of dancers had not heard of Relative Energy Deficiency in Sport, probably because they do not self-identify as sportsmen/sportswomen. Yet the peer pressure of dance schools and dance companies, combined with ever present social media, can lead some dancers to restrict energy intake to levels that are insufficient to meet the high demands of training and performance.

Fit to dance

The authors hope that the publication of this study will help raise awareness in the dance community of the importance of fuelling for the work required. The fact that physical outcomes are connected, via hormones, to mental attitudes is particularly relevant during the COVD crisis, which has impacted the dance world in such a tragic way. The hope is that dancers will be fully fit and healthy to return to the stage, when the theatres eventually open.

References

Indicators and correlates of low energy availability in male and female dancers
Nicola Keay, AusDancers Overseas, Gavin Francis

Energy Availability: Concept, Control and Consequences in relative energy deficiency in sport (RED-S)

Low energy availability assessed by a sport-specific questionnaire and clinical interview indicative of bone health, endocrine profile and cycling performance in competitive male cyclists, Nicola Keay, Gavin Francis, Karen Hind

No drafting

In a fascinating white paper, Bert Blocken, Professor of Civil Engineering at Eindhoven University of Technology, comments on social distancing when applied to walking, running or cycling. His point is that the government recommendations to maintain a distance of 1.5 or 2 metres assume people are standing still indoors or outdoors in calm weather. However, when a person is moving, the majority of particulate droplets are swept along in a trailing slipstream.

Cyclists typically prefer to ride closely behind each other, in order to benefit from the aerodynamic drafting effect. Cycling is currently a permitted form of exercise in the UK, though only if riding alone or with members of your household. Nevertheless, there may be times when you find yourself catching up with a cyclist ahead. In this situation, you should avoid the habitual tendency to move up into the slipstream of the rider in front.

Professor Blocken’s team has performed computational fluid dynamics (CFD) simulations showing the likely spread of micro-droplets behind people moving at different speeds. As the cloud of particles, produced when someone coughs or sneezes, is swept into the slipstream, the heavier droplets, shown in red in the diagram above, fall faster. These are generally thought to be more considerably more contagious. You can see that they can land on the hands and body of the following athlete.

Based on the results, Blocken advises to keep a distance of at least four to five meters behind the leading person while walking in the slipstream, ten meters when running or cycling slowly and at least twenty metres when cycling fast.

Social Distancing v2.0

The recommendation, for overtaking other cyclists, is to start moving into a staggered position some twenty metres behind the rider in front, consistently avoiding the slipstream as you pass.

The results will be reported in a forthcoming peer-reviewed publication. But given the importance of the topic, I recommend that you take a look at the highly accessible three page white paper available here.

References

Social Distancing v2.0: During Walking, Running and Cycling
Bert Blocken, Fabio Malizia, Thijs van Druenen, Thierry Marchal

Modelling Strava Fitness and Freshness

Since my blog about Strava Fitness and Freshness has been very popular, I thought it would be interesting to demonstrate a simple model that can help you use these metrics to improve your cycling performance.

As a quick reminder, Strava’s Fitness measure is an exponentially weighted average of your daily Training Load, over the last six weeks or so. Assuming you are using a power meter, it is important to use a correctly calibrated estimate of your Functional Threshold Power (FTP) to obtain an accurate value for the Training Load of each ride. This ensures that a maximal-effort one hour ride gives a value of 100. The exponential weighting means that the benefit of a training ride decays over time, so a hard ride last week has less impact on today’s Fitness than a hard ride yesterday. In fact, if you do nothing, Fitness decays at a rate of about 2.5% per day.

Although Fitness is a time-weighted average, a simple rule of thumb is that your Fitness Score equates to your average daily Training Load over the last month or so. For example, a Fitness level of 50 is consistent with an average daily Training Load (including rest days) of 50. It may be easier to think of this in terms of a total Training Load of 350 per week, which might include a longer ride of 150, a medium ride of 100 and a couple of shorter rides with a Training Load of 50.

How to get fitter

The way to get fitter is to increase your Training Load. This can be achieved by riding at a higher intensity, increasing the duration of rides or including extra rides. But this needs to be done in a structured way in order be effective. Periodisation is an approach that has been tried and tested over the years. A four-week cycle would typically include three weekly blocks of higher training load, followed by an easier week of recovery. Strava’s Fitness score provides a measure of your progress.

Modelling Fitness and Fatigue

An exponentially weighted moving average is very easy to model, because it evolves like a Markov Process, having the following property, relating to yesterday’s value and today’s Training Load.
F_{t} = \lambda * F_{t-1}+\left ( 1-\lambda  \right )*TrainingLoad_{t}
where
F_{t} 
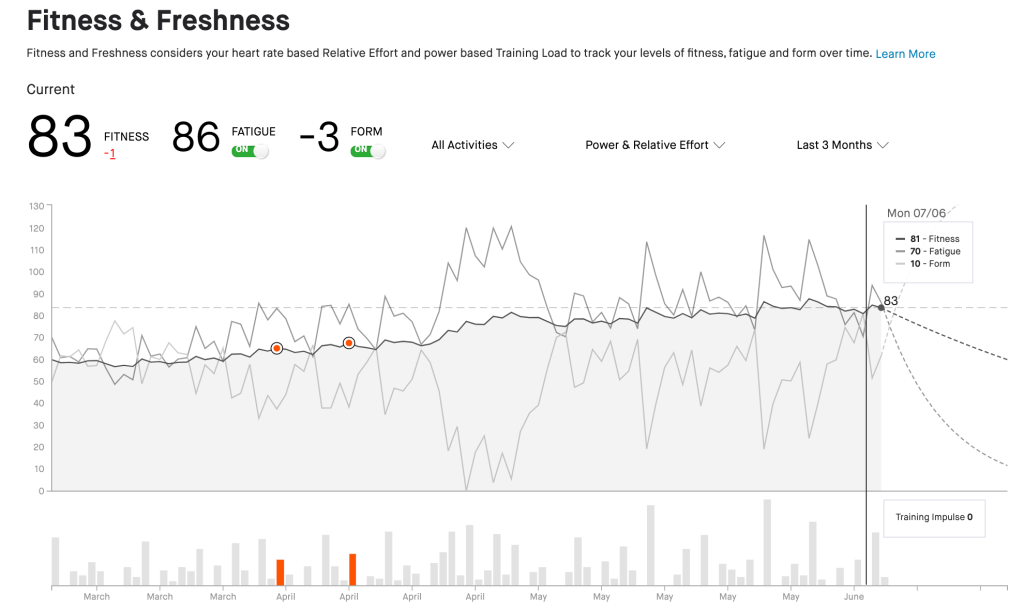
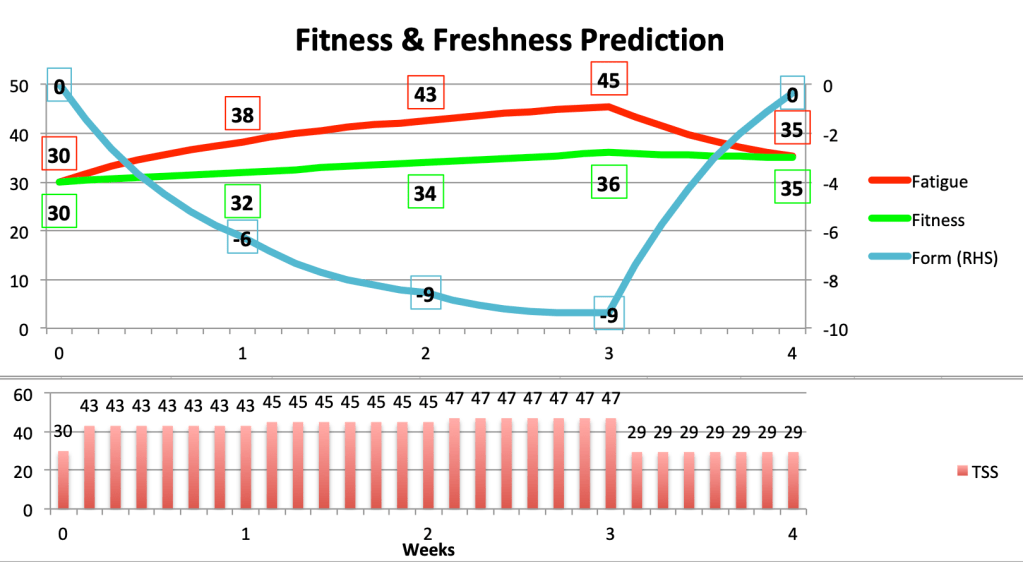
is Fitness or Fatigue on day t and
\lambda = exp(-1/42) \approx 0.976 for Fitness or
\lambda = exp(-1/7) \approx 0.867 for Fatigue

This is why your Fitness falls by about 2.4% and your Fatigue eases by about 13.3% after a rest day. The formula makes it straightforward to predict the impact of a training plan stretching out into the future. It is also possible to determine what Training Load is required to achieve a target level of Fitness improvement of a specific time period.

Ramping up your Fitness

The change in Fitness over the next seven days is called a weekly “ramp”. Aiming for a weekly ramp of 5 would be very ambitious. It turns out that you would need to increase your daily Training Load by 33. That is a substantial extra Training Load of 231 over the next week, particularly because Training Load automatically takes account of a rider’s FTP.

Interestingly, this increase in Training Load is the same, regardless of your starting Fitness. However, stepping up an average Training Load from 30 to 63 per day would require a doubling of work done over the next week, whereas for someone starting at 60, moving up to 93 per day would require a 54% increase in effort for the week.

In both cases, a cyclist would typically require two additional hard training rides, resulting in an accumulation of fatigue, which is picked up by Strava’s Fatigue score. This is a much shorter term moving average of your recent Training Load, over the last week or so. If we assume that you start with a Fatigue score equal to your Fitness score, an increase of 33 in daily Training Load would cause your Fatigue to rise by 21 over the week. If you managed to sustain this over the week, your Form (Fitness minus Fatigue) would fall from zero to -16. Here’s a summary of all the numbers mentioned so far.

Impact of a weekly ramp of 5 on two riders with initial Fitness of 30 and 60

Whilst it might be possible to do this for a week, the regime would be very hard to sustain over a three-week block, particularly because you would be going into the second week with significant accumulated fatigue. Training sessions and race performance tend to be compromised when Form drops below -20. Furthermore, if you have increased your Fitness by 5 over a week, you will need to increase Training Load by another 231 for the following week to continue the same upward trajectory, then increase again for the third week. So we conclude that a weekly ramp of 5 is not sustainable over three weeks. Something of the order of 2 or 3 may be more reasonable.

A steady increase in Fitness

Consider a rider with a Fitness level of 30, who would have a weekly Training Load of around 210 (7 times 30). This might be five weekly commutes and a longer ride on the weekend. A periodised monthly plan could include a ramp of 2, steadily increasing Training Load for three weeks followed by a recovery week of -1, as follows.

Plan of a moderate rider

This gives a net increase in Fitness of 5 over the month. Fatigue has also risen by 5, but since the rider is fitter, Form ends the month at zero, ready to start the next block of training.

To simplify the calculations, I assumed the same Training Load every day in each week. This is unrealistic in practice, because all athletes need a rest day and training needs to mix up the duration and intensity of individual rides. The fine tuning of weekly rides is a subject for another blog.

A tougher training block

A rider engaging in a higher level of training, with a Fitness score of 60, may be able to manage weekly ramps of 3, before the recovery week. The following Training Plan would raise Fitness to 67, with sufficient recovery to bring Form back to positive at the end of the month.

A more ambitious training plan

A general plan

The interesting thing about this analysis is that the outcomes of the plans are independent of a rider’s starting Fitness. This is a consequence of the Markov property. So if we describe the ambitious plan as [3,3,3,-2], a rider will see a Fitness improvement of 7, from whatever initial value prevailed: starting at 30, Fitness would go to 37, while the rider starting at 60 would rise to 67.

Similarly, if Form begins at zero, i.e. the starting values of Fitness and Fatigue are equal, then the [3,3,3,-2] plan will always result in a in a net change of 6 in Fatigue over the four weeks.

In the same way, (assuming initial Form of zero) the moderate plan of [2,2,2,-1] would give any rider a net increase of Fitness and Fatigue of 5.

Use this spreadsheet to experiment.